


Arctic and Antarctic Research Institute
Россия
Saint Petersburg State University
Россия
Purpose. The paper aims at the studies of features of seasonal variation of the main semidiurnal and diurnal tides in the annual cycle in the Barents and Kara seas according to the long-term data of sea level observations at all points (stations). The structure of seasonal course of the tide is estimated on the example of the M2 and K1 tides and physical mechanisms of its formation. Methods and Results. The work was carried out according to the data of long-term tide gauge hourly observations of the sea level and 6-hourly interval series of the sea level measurements mainly from the ESIMO database from 1977 to the end of observations. Marine hydrometeorological year-book data since 1951 were also used. On the basis of the harmonic analysis of tides with the least square method of hourly annual and monthly time series of sea level, the average monthly values of amplitudes and phases of the main semidiurnal and diurnal tides at 17 points in the Barents Sea and 19 points in the Kara Sea are estimated. In general, the range of seasonal course of the M2 tide in the Barents Sea increases from north to south and is most significant in the southeast of the sea. According to our classification, classic type 1 of the seasonal course of the M2 tide is not predominant and is 35%, and anomalous type 3 is the most observed one, reaching 41% of 17 points. In the Kara Sea, classic type 1 of seasonal course of the M2 tide is mainly observed with an amplitude maximum and phase minimum in July–September, manifesting itself in 74% of all cases in 19 points. Conclusions. At each point of the Barents and Kara seas, individual time-stable seasonal annual course of main semidiurnal, diurnal and shallow tides is observed. The seasonal course of harmonic constants differs significantly among the points in terms of the degree of severity, shape of curves, time of occurrence of extreme values and magnitude of oscillation range. Moreover, seasonal variations of the constants of semidiurnal and diurnal tides are different. In the Barents Sea, the influence of drifting ice cover on the seasonal variations of main semidiurnal tides is much weaker than in the Kara Sea. The seasonal variations of amplitudes and phases of the daily K1 tide are dominated by the semiannual period. The maximum deviations of amplitudes from the mean annual value (norm) are mainly 10–20%, and those of phases – 6–16°.
Arctic, Barents Sea, Kara Sea, harmonic analysis of tides, seasonal course of the M2 tide, seasonal course of the K1 tide, amplitude, tide phase
Introduction
The first information on the intra-annual course of the tide were found in the work of A. M. Bukhteev The results of the analysis of 12-month hourly series of tides for 1906–1907 in the Ekaterininskaya Gavan (settlement of Polyarnoe, the Barents Sea) by the Darwin method were presented. However, due to the complete absence of pronounced course in the tide in the annual cycle and presence of seasonal variations (small in magnitude) only in the М2 tide amplitude, A. M. Bukhteev did not interpret this phenomenon as seasonal course.
For the first time in the world practice of tidal analysis, data on their seasonal course and an analytical model of the annual course of the М2 tide disturbance were given in the work of R. H. Corkan [1]. This study was innovative and, perhaps, for this reason, it remained unclaimed for a long time. The model of R. H. Corkan in tide prediction has been used only since the end of the 20th century. As a result of the implementation of the project for the Northern Sea Route (NSR) development and the study of the tides of the Arctic seas of Russia in the 1930–40s, short-term (monthly and half-monthly) series of sea level observations were obtained at a number of polar stations. The results of tide processing by the Darwin method in the Kara and Laptev seas were published in eight issues of materials
A review of the results of the first issues of these materials made it possible for W. J. Wiese [2] to conclude that seasonal course of the tides of the Arctic seas is a widespread phenomenon. Based on these data, it was established that the amplitude of the tide decreases in winter and high water occurs later than in summer. This work proposed to relate the harmonic constants of the tide, determined at some time at a specific point, to the season or even to a specific month of the year. Later, the author of [3] explained the intra-annual fluctuations of the tide constants by the influence of not only fluctuations in the ice cover of the Arctic seas, but also long-term changes in the wind regime.
These publications, as new observations were obtained, gave rise to numerous studies of the seasonal course of the tides of the Arctic seas of Russia [4]. To estimate the ice cover influence on the tidal constants, it was proposed in [4] to use coefficients of tide attenuation per kilometer of its path and corresponding delay in fractions of an hour. Subsequently, it was shown in [5] that the formulas used to calculate these coefficients gave extremely large calculation errors (up to 100%). Therefore, the obtained connections are not significant and reliable.
Many works of the mid-20th century on the key issue of seasonal course of the tide from the standpoint of modern science turn out to be not entirely reliable and even erroneous [6, 7] because of the following reasons.
1. Shortcomings of the tidal analysis methodology of that time and errors in the tidal analysis methods used.
2. Insufficiency of continuous annual series of tidal observations to obtain stable monthly mean values of tide constants or their seasonal variation.
3. Underestimation of the progressive model of R. H. Corkan [1] and use of non-harmonic characteristics (tide applied hour and magnitude) to estimate the seasonal course of tides.
4. Technical reason (lack of powerful computing tools until the early 1970s).
Let us reveal the content of the first, main reason (except for the other quite understandable ones). Previously, the 15-day series results processed by the Darwin method and the Admiralty method (AM) of tidal analysis per day were widely used. In the 1960s, many works appeared on the shortcomings of the Darwin method for 30 and 15 days, especially [8]. The tide constants obtained from the semi-monthly series analysis have a pronounced time periodicity depending on astronomical conditions. To an even greater extent, this concerns the results of the analysis of daily observation cycles by the AM. The combined use of the results of processing monthly, semi-monthly and especially daily series for studying seasonal variations in tides is unacceptable.
A serious methodological error in many domestic works was the use of arithmetic averaging of the processing results (amplitudes and phases of tides), rather than the vector average calculation. The differences in the averaging results with large values of the spread of the tide amplitudes and phases can be large. By the way, it was demonstrated in [9], although the vector averaging method was not used later.
Calculation errors of this or that method and the accuracy of the obtained tides were not assessed at all. The calculations were checked not by the residual series, but by the precalculated one. Therefore, the defects in the observations were not recognized.
When using heterogeneous (in terms of processing) data with the arithmetic averaging technique, it is possible to obtain a completely unreliable dependence like in [6] where erroneous values of seasonal variations in the М2 tide amplitudes and phases are given for Dikson Island, Cape Chelyuskina, Kotelny Island and Tiksi Bay. Nevertheless, the main conclusions of this work still remain relevant.
In the work 4, when studying the Chukchi and the Beaufort Sea tides, the AM was used as the main method of harmonic analysis. To determine the seasonal course of the tides at such points as Cape Schmidt, Wrangel Island and Ratmanov Island, the results of analyses for several years were arithmetically averaged for individual months of the year. However, the AM accuracy is low and depends on the influence of the level non-periodic fluctuations 6. Therefore, the obtained results of the curves of the М2 tide seasonal course differ significantly from modern estimates [10, 11].
In the monograph on the Arctic Ocean (AO) tides [7], the М2 tide seasonal course was studied for the Barents, White and Arctic (Kara, Laptev, East Siberian and Chukchi) seas. In each of these seas, 1–2 points with continuous hourly annual series were considered. The results of half-monthly series processing were widely used to construct the seasonal variation of the М2 tide amplitudes and phases. That is why, even taking into account the results of processing of three annual series (one was taken from the work 1), the seasonal variation of the М2 tide constants in the Ekaterininskaya Gavan remained uncertain. Questionable results were also given for Teriberka Bay.
Later, in [8], point Ekaterininskaya Gavan was also considered, but the results of monthly series processing were taken, which made it possible to obtain a reliable seasonal course in the tidal amplitude but it still remained uncertain in the phase.
In [7], an attempt to classify the seasonal course of the tide in the Arctic seas was made but non-harmonic constants were used as criteria – the applied hour and the average spring tide value. If the applied hour is associated with the phase of the М2 tide, then the tide value is determined by the values of the amplitudes of all the main tides. That is, the use of such criteria does not make physical sense for estimating the М2 tide seasonal course and even more so for its typification. In essence, this meant a refusal to use the results of harmonic analysis. Therefore, no progress was achieved in understanding the mechanisms of the seasonal course of tides.
Unfortunately, extensive work 5 on tidal phenomena in the Arctic seas had the aforementioned shortcomings (see points 1–3 above). As in other works, the results of processing half-monthly series were used to estimate the seasonal variation. The arithmetic averaging method was used to estimate the average seasonal annual variation of the М2 tide amplitudes and phases. As a result, a stable intra-annual seasonal variation of the М2 tide amplitudes and phases was not obtained for any of eight points cited in the work. Only a trend in individual seasons of the year was essentially revealed.
A review of the works on explaining the phenomenon of the seasonal tide variation in the 20th century is contained in publications [10, 11]. Following this review, we note that in [12, 13], the analytical model of R. H. Corkan [1] was supplemented and it was established that the annual disturbances of the M2 and S2 tides were similar and were caused by disturbing tides that were generated by meteorological factors and formed an annual modulation in M2, and the secondary MSK2 and MKS2 tides, being a result of friction forces, cause a semi-annual modulation. For the S2 tide, the annual course is created by non-gravitational components of the T2 and R2 tides associated with meteorological causes.
In theoretical terms, the question of the ice cover influence on tidal phenomena in the Arctic seas was studied in [14, 15] where analytical solutions for particular cases of the propagation of Sverdrup and Poincaré waves in an idealized channel on open water and under ice cover were obtained. In these works, the conclusion about the weak influence of drifting ice on the tide and tidal currents was made.
The ice cover influence on the М2 tide in the Arctic basin was studied by numerical experiments in [16], concluding the weak influence of drifting ice on the tide propagation.
In [17], based on the results of tidal dynamics modeling in the Arctic Ocean covered by drifting ice, a conclusion was made about the strong influence of fast ice and the weak influence of drifting ice on the formation of tides.
At the beginning of the 21st century, works where seasonal variations of the М2 tide were explained not by ice cover but by other factors appeared. In [18], using numerical experiments with the assimilation of both coastal observations and altimetry measurements of the Topex-Poseidon mission, the dependence of the seasonal course of the М2 tide on meteorological forces (up to 60% of the seasonal course) was established in the North Sea.
A completely different but very indicative approach to explaining the seasonal course of the М2 tide was presented in [19]. A 2D model showed that seasonal stratification of water masses in the Yellow and East China Seas was responsible for the seasonal course of the М2 tide. An extensive study of the seasonal course of the М2 tide in the World Ocean using numerical modeling with the altimetry data assimilation for 19 years and long-term level measurements at points was carried out in [20]. The Arctic region is covered partially due to limitations in the satellite trajectories. The influence of meteorological forces and river runoff on the tides was not taken into account in recent studies. It is clear that a wide field for future research remains open.
The results of mass processing of long-term time series of sea level observations in the Arctic seas for studying the seasonal course of tides are presented in [10, 11, 21, 22].
Seasonal course features of the main tides in the White, Laptev and Chukchi seas (six points in total) are considered in [23] where significant differences in the type of seasonal variation curves are noted both between points in one sea and between regions. When predicting tides in the seas, it is recommended to take seasonal course into account.
It follows from the aforementioned works that the most significant seasonal course of tides in the annual cycle, which is not associated with astronomical reasons, is observed in the AO on the shelf of the Arctic seas.
Due to the new project for the NSR development and advancement in the 21st century, a request for detailed studies of the patterns of distribution of sea tides in the shelf zone of the Arctic seas arose.
The paper aims at studying seasonal variation features of the main semidiurnal and diurnal tides in the annual cycle in the Barents and Kara seas where long-term hourly or urgent (four times a day) sea level observations were carried out.
Data and methods
The database of hourly tide gauge observations and urgent (four times a day) tide gauge measurements of sea level from the portal of the Unified System of Information on the Situation in the World Ocean (ESIMO, available at: https://esimo.ru) (All-Russian Research Institute of Hydrometeorological Information – World Data Center) for the period from 1977 until the end of observations was used as a basis for processing and analysis. Observations before 1977 in the Barents and Kara seas were selected from the materials stored in the AARI funds (tables TGM-8 for hourly data and TGM-1 for urgent measurements), as well as from materials 2. The materials of long-term observations of the level at 17 points of the Barents Sea and 19 points of the Kara Sea for different periods, mainly from 1962 (1977) to 1993 (and later) were used to study the seasonal course of semidiurnal and diurnal tides (Fig. 1, Table).
The longest series of hourly sea level observations were over 50 years (Table). On the contrary, some points with short-term hourly data (Tikhaya Bay – four years, the mouth of the Indiga River – seven years) were also observed. In general, the length of the series exceeded the nodal cycle period (19 years).
In the late 1980s – early 1990s, personal computers replaced electronic data processing machines in the USSR, which made it possible to process long-term time series of observations and apply harmonic analysis of tides using the least squares method (LSM).
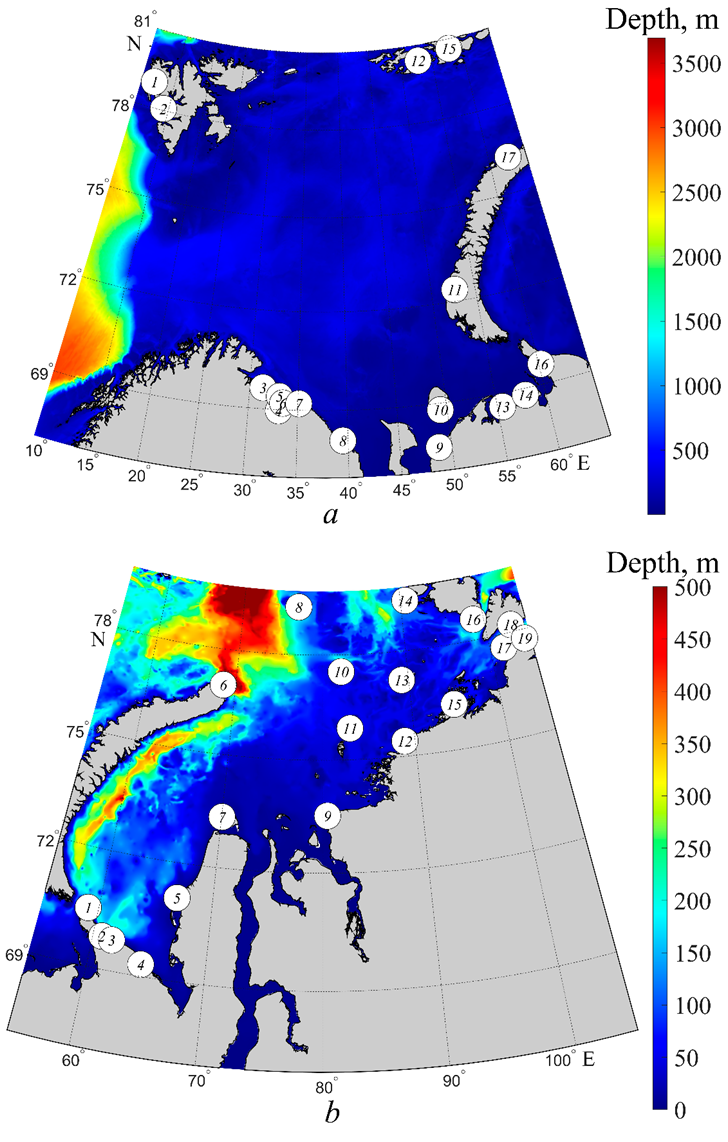
F i g. 1. Location of sea level observation points (stations) in the Barents (a) and Kara (b) seas (see Table for names of points)
Initial time series of sea level observations in the Barents and Kara seas
|
Point number |
Point name |
Latitude, ° N |
Longitude, ° E |
Analysis period |
Number of years analyzed |
|
1 |
2 |
3 |
4 |
5 |
6 |
|
Barents Sea |
|||||
|
1 |
New Alesund (West Svalbard) |
78.93 |
11.95 |
1977–2018 |
42 |
|
2 |
Port of Barentsburg |
78.07 |
14.25 |
1977–2012 |
36 |
|
3 |
Liinahamari (mouth of the Pechenga River) |
69.63 |
31.37 |
1977–2004* |
26 |
|
4 |
Port of Murmansk |
68.97 |
33.07 |
1977–2012 |
35 |
|
5 |
Kislogubskaya PES Bay |
69.40 |
33.10 |
1977–1992 |
16 |
|
6 |
Polyarnoe (Ekaterininskaya Gavan) |
69.20 |
33.47 |
1958–2015 |
58 |
|
7 |
Teriberka Bay |
69.20 |
35.10 |
1951–2015 |
65 |
|
8 |
Yokanga Bay |
68.10 |
39.50 |
1977–1993 |
17 |
|
9 |
Mouth of the Indiga River |
67.70 |
48.77 |
1977–1989* |
7 |
|
10 |
Bugrino (Kolguev Island) |
68.80 |
49.33 |
1977–1996** |
20 |
|
11 |
Malye Karmakuly (polar station) |
72.37 |
52.68 |
1977–2012** |
36 |
|
12 |
Tikhaya Bay |
80.35 |
52.80 |
1954–1957 |
4 |
|
13 |
Cape Konstantinovskiy |
68.60 |
55.50 |
1977–1990* |
11 |
|
14 |
Varandey Island |
68.80 |
57.97 |
1978–1994* |
11 |
|
15 |
Heiss Island (E. T. Krenkel observatory) |
80.60 |
58.00 |
1972–1991 |
20 |
|
16 |
Cape Belyy Nos |
69.60 |
60.22 |
1962–1992** |
31 |
|
17 |
Russkaya Gavan Bay |
76.20 |
62.58 |
1966–1991 |
26 |
|
Kara Sea |
|||||
|
1 |
(Cape Bolvanskiy Nos (named after E. K. Fedorov) |
70.45 |
59.08 |
1962-1993 |
32 |
|
2 |
Yugorskiy Shar (polar station) |
69.82 |
60.77 |
1962-1989 |
28 |
|
3 |
Port of Amderma |
69.77 |
61.68 |
1962-1991 |
30 |
|
4 |
Mouth of Ust-Kara River |
69.30 |
64.50 |
1962–1999* |
38 |
|
5 |
Cape Kharasavey |
71.10 |
66.75 |
1962–1979* |
18 |
|
6 |
Cape Zhelaniya |
76.95 |
68.57 |
1962-1983 |
22 |
|
7 |
Belyy Island (named after M. E. Popov) |
73.33 |
70.03 |
1945–1982* |
10 |
|
8 |
Wiese Island |
79.48 |
76.98 |
1963–1980* |
18 |
|
9 |
Dikson Island |
73.50 |
80.50 |
1962-1992 |
31 |
|
10 |
Uyedineniya Island |
77.50 |
82.20 |
1967–1990* |
24 |
|
11 |
Izvestiya TSIK Islands |
75.87 |
83.03 |
1962-2015 |
54 |
|
12 |
Cape Sterlegova |
75.42 |
88.90 |
1963–1990* |
28 |
|
13 |
Isachenko Island |
77.15 |
89.20 |
1962–1990* |
29 |
|
14 |
Golomyannyy Island |
79.55 |
90.62 |
1963–2006 |
44 |
|
15 |
Pravdy Island |
76.27 |
94.77 |
1962–1992 |
31 |
|
16 |
Krasnoflotskie Islands |
78.63 |
98.73 |
1968-1987 |
20 |
|
17 |
Heiberg Islands |
77.60 |
101.63 |
1967-1994 |
28 |
|
18 |
Solnechnaya Bay |
78.22 |
103.07 |
1962-1991 |
30 |
|
19 |
Cape Chelyuskina (E. K. Fedorov observatory) |
77.72 |
104.28 |
1962-1996 |
35 |
* The hourly series of observations contain some gaps.
** The 6-hourly interval series of sea level measurements are considered as well as all short-term hourly observations.
In the 1990s, a new methodological approach to the processing and analysis of sea tides was developed at AARI. Extended harmonic analysis of sea tides by the LSM is carried out according to a new technique with the inclusion of tides describing the seasonal course of the main semidiurnal, diurnal and shallow-water tides [10, 11, 21]. The method versions have been developed for the analysis of irregular observations, anomalous shallow-water tides and urgent observations [10, 11, 24–28]. The fundamental difference between the new version of extended harmonic analysis of sea tides by the LSM and other versions of this method is that it provides an adequate description of the seasonal course of tidal fluctuations in sea level for areas with a strongly expressed or anomalous course of tide constants in the annual cycle.
In [21], for the first time in the world practice of tidal analysis, seasonal course of main shallow tides was discovered. Complex combination tides responsible for the seasonal course of the M4, MS4, MN4, M6, 2MS6 and 2SM6 main shallow tides were identified and described. Taking these tides into account, the extended harmonic tidal analysis according to the AARI version makes it possible to identify 225 tides from the hourly annual series.
The classification of the types of seasonal course of tides of the main semidiurnal (М2, S2 and N2) and diurnal (K1 and O1) tides is given in [11] first in the world practice based on the results of the monthly series analysis over a long period at 19 points in the Arctic seas.
Here, no possibility of individual description of the features of harmonic analysis of tides at each point is given. Depending on the series length, their discreteness and quality of observations, various LSM versions were used in several approximations. All points were analysed with the LSM both for the entire observation period both for annual and monthly series but in the final form, a tidal model with tides describing the seasonal course of the tide was created for each point. An adequate tidal model was also created in parallel in the form of 12 files with harmonic constants of tides extracted from monthly series (32 tides in each month). In this case, for monthly series, the results for the K1, S2 and N2 tides in the second approximation were corrected to avoid the influence of the secondary p1, y1, j1, Р1, К2, Т2, R2, n2 tides according to theoretical relationships. When studying the intra-annual course of the tide for the М2, S2, N2, K1 and O1, M4, MS4, M6 tides, the average vector values of the amplitudes and angles of the positions (phases) of the harmonics were calculated for each month of the year.
The seasonal variation of the amplitude is presented as relative change (dH) in its average value (H) as dH = (Hm – Hg)/Hg (in percent), where Hm is average vector value of all series for a given month; Hg is average vector value for the entire period. Seasonal variation of the phase (dg) is given as a deviation of the average value of all series for a given month from the average for the entire period: dg = (gm – gg). The standard deviation (SD, or σ) for the amplitude and phase was calculated using formulas for the vector average errors. For this purpose, the average and individual monthly values of the amplitude and phase were transformed into the Hcosg and Hsing components. Based on them, the standard error was calculated for the σH amplitude and then for the σg phase [9].
To accomplish the task, long-term homogeneous hourly series reduced to one time zone and a single zero post are needed.
As a rule, scientific publications almost never disclose the reasons for gaps in observations of the level in the Arctic seas and poor data quality. This is considered a topic beyond the scope of a scientific paper. We will cover this issue in more detail here.
As is known, sea level observations in the Far North are carried out in very severe climatic conditions with risk to life. Of 19 points in the Kara Sea, only five had permanent tide gauge installations: the port of Amderma, Dikson Island, Cape Zhelaniya, Heiss Island and the Izvestiy TSIK Islands. At the remaining points, observations were carried out in the summer using temporary installations, and in the winter – in gullies on coastal fast ice, which is sometimes subject to destruction. Therefore, gaps in observations were caused by the impossibility of creating temporary installations during periods of fast ice destruction in spring or their destruction in summer under the influence of storms and drifting ice and in the transitional winter period before stable fast ice formation.
Gaps create inconveniences in calculations due to breaks in time series but they are not an obstacle to conducting harmonic analysis of tides by the LSM [24]. In fact, the quality of level observations depends not so much on gaps as on situations related to violations of the requirements of the Manual for Meteorological Stations and Posts, poor performance of instruments and dishonesty of observers [25–28].
According to [25–28], high-quality observations were carried out in the late 1950s – early 1980s. As the instrument base aged and the working conditions of observers worsened as well as due to a decrease in their qualifications and lack of regular inspection control, the quality of sea level observations also decreased.
In the 1990s, due to the Soviet Union collapse and the closure of a number of stations on the NSR due to lack of funding, a sharp deterioration in the quality of observations took place as an objective reason for the poor quality of observations. A subjective one was represented by the formation of the database that we received at ESIMO. It consisted of incorrect processing of mareograms untied by urgent sea level measurements. According to the rules of the instructions and requirements of the methodological departments of the research institutes, these urgent level measurements should be made strictly at whole hours. In practice, due to an insufficient number of observers, this rule cannot be observed, since the same observer is not able to be at the meteorological site and at the level post at the same time. Therefore, observers recorded not the true time of measurements but the required one (i.e. equal to a whole hour). Accordingly, mareograms were not processed according to the true time, errors were introduced into them (within ±30 minutes or more). As a result, the time series lost their homogeneity [25–28].
To bring the sea level time series to a homogeneous state, a new methodology presented in general terms as a tide calibration method was developed [28]. It allows identifying questionable observations and defects of various origins in the level time series and, therefore, obtaining an objective estimate of the observation data quality.
In general, the state of the polar station network and, in particular, production of sea level observations has remained virtually unchanged compared to the level of the early 1990s described in detail in [29].
The best quality of sea level observations was achieved in the middle of the 20th century and steadily declined at the end of it. However, it was in the very middle of this period that sea level measurements were carried out in different time systems and with different altitude references. Until April 1961, local solar time was used, then – time alternately according to the second or third time zone until 1969, then – mainly according to the third time zone (Moscow decree) until 1990 and the time of the zero zone (Greenwich Universal Time) since 1991. The Baltic altitude system was introduced in 1991.
We converted measurement data into whole hours during observations in local time with direct and inverse Fourier transform [25].
Results and their analysis
It is known that the seasonal course of main tides has a stable quasi-periodic form at each point in the Arctic seas and in the seas of the World Ocean and the form of amplitude and phase curves of the main tides (conditionally the genotype) does not practically change over time [1, 10, 11]. The results of seasonal course study obtained at points with the longest time series confirm this conclusion. Therefore, this work presents estimates of the average monthly values of amplitudes and phases of the M2 and K1 tides in the Barents and Kara seas for a period of 19–38 years from the beginning of observations at each point.
For a compact presentation, the estimate results of the seasonal course of tides were grouped by several geographical areas in each sea. Fig. 2 shows seasonal course of the M2 tide amplitude and phase in three areas of the Barents Sea. It is evident that in all six points of the Murmansk Coastal Region (from Liinahamari to Yokanga) (Fig. 2, a), the amplitude seasonal course has an identical shape of curves. An annual periodicity with a maximum amplitude in August (with an increase in the average annual norm by 3–4%) and a minimum phase in March (with a decrease of only 1–2° from the specified norm) is observed. According to the classification from [11], anomalous type 3 seasonal course is observed in this region.
The range of the seasonal variation is weakly expressed in the north of the Barents Sea (Fig. 2, b) on Spitsbergen Island (New Alesund and Barentsburg points). In the annual cycle, the amplitude increase in June is only 0.8–0.9% of the norm and phase decrease in September is about 1°. Seasonal variation proceeds here according to anomalous type 2. An anomalous seasonal tide variation of type 2 is distinguished at the Russkaya Gavan point (north of Novaya Zemlya) where the maximum amplitude is observed in April and reaches 3% and the minimum phase is observed in September and is about 7° below the norm. In Tikhaya Bay and on Heiss Island (Fig. 2, b), the seasonal variation is close to classical type 1, i.e. the amplitude increases in August–September and the phase also reaches its minimum in the summer.
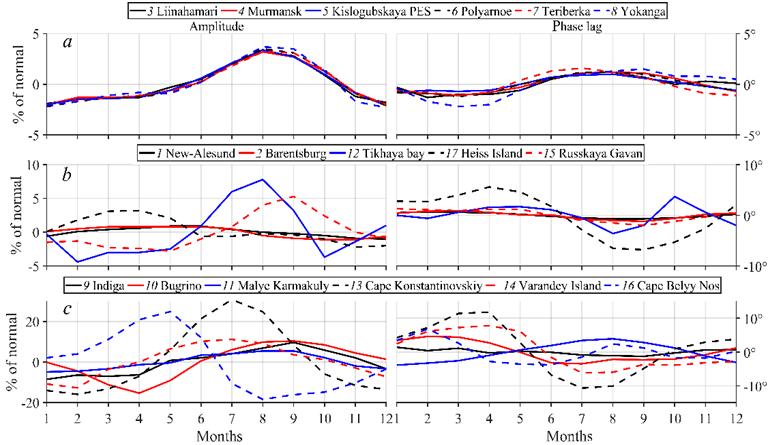
F i g. 2. Seasonal variation of the M2 tide in the Barents Sea
The greatest differences in the type of seasonal variation curves and the most extreme values of amplitudes and phases are observed in the southeastern Barents Sea (Fig. 2, c). Indiga, Konstantinovskiy and Varandey points are located in the Kanino-Pechora Region (Fig. 1). The most pronounced seasonal variation of the M2 tide is noted at Konstantinovskiy point (Pechora Bay) where the maximum amplitude of up to 31% of the norm and the minimum phase of up to 11° below the norm are observed in July.
In Pechora Bay, at Varandey and Konstantinovskiy points, the type of seasonal variation curves of amplitudes and phases is identical but the range of oscillations is smaller in the former. Classical type 1 of the seasonal variation is observed at both points which is also noted at Bugrino (Kolguev Island) where the increase in the M2 tide amplitude in September reaches 10% of the norm and the decrease in the phase in the summer period is no more than 4°.
On Novaya Zemlya, at Malye Karmakuly, the seasonal course of the M2 tide amplitude in the annual cycle reaches its maximum in August and is almost 6% of the norm. The phase course curve has an anomalous shape and a maximum in July which is about 5° from the norm. As a result, this seasonal variation can be attributed to anomalous type 3.
Finally, at Belyy Nos (south of the Yugorskiy Shar Strait), the maximum amplitude in the seasonal course occurs in May (about 25% above the norm) and in the phase seasonal course, a semi-annual periodicity with a minimum in June at 4° below the norm takes place. Therefore, type 4 of seasonal course is manifested here.
In general, the range of seasonal tide course in the Barents Sea increases from north to south and is most pronounced in the southeast of the sea.
Note that the average seasonal course of the semidiurnal M2, S2 and N2 tides has similar features but we can trace differences in the type of curves which are associated with differences in the spatial distribution of these tides. As a rule, annual periodicity prevails in the course of amplitudes and phases.
Classical type 1 of the seasonal M2 tide course is not predominant and makes up 35% and anomalous type 3 is the most observed one, reaching 41% of 17 points. This fact can serve as indirect evidence that the impact of drifting ice cover is not the main factor in the formation of tide seasonal course in the Barents Sea. The points located in Pechora Bay where fast ice is formed in winter can be considered an exception.
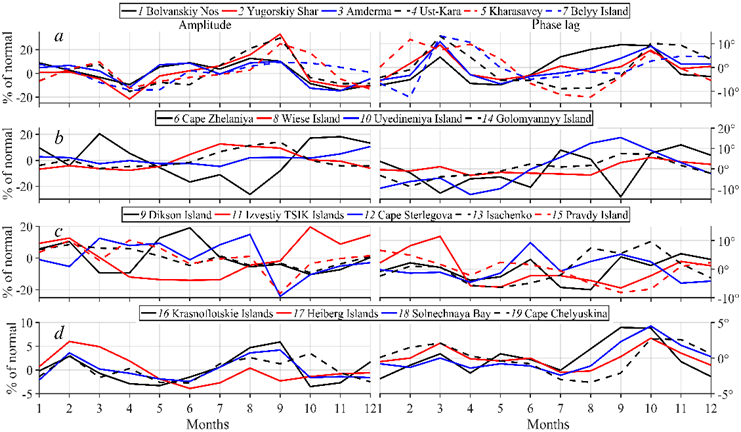
Fig. 3 demonstrates the seasonal course curves of the M2 tide amplitudes and phases in the Kara Sea grouped into four regions. We had the results of tide seasonal course in the Gulf of Ob and the Yenisei Gulf at our disposal but did not use them in this work since they are of independent interest. We will consider one more cause below.
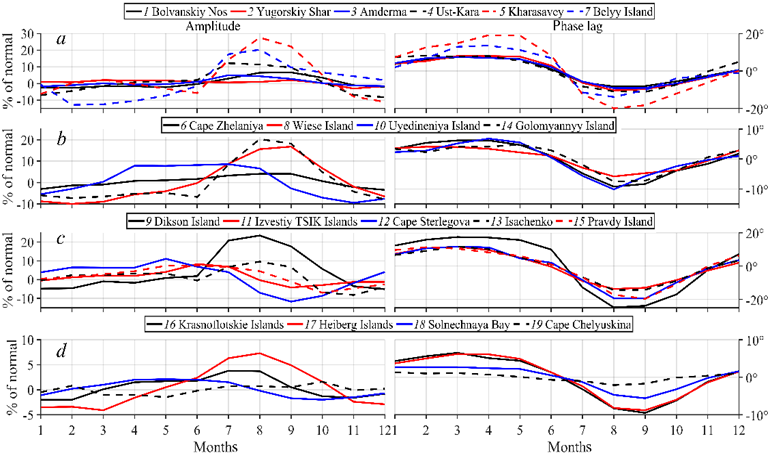
F i g. 3. Seasonal variation of the M2 tide in the Kara Sea
A priori, one should expect similar changes in the seasonal course curves of the M2 tide at points in the southwestern Kara Sea located in the same region homogeneous in hydrometeorological conditions. Indeed, the phase seasonal course at all points shows good agreement in the annual cycle (Fig. 3, a). However, significant differences are observed in the seasonal course of the M2 tide amplitudes between points. In the variation of the M2 tide curves, the annual course is expressed very weakly at Yugorskiy Shar and most clearly at Kharasavey with a maximum in August exceeding the norm by 28%.
In the northern part of the sea (Cape Zhelaniya, Wiese, Uyedineniya and Golomyannyy islands), seasonal course of amplitude and phase curves has classical type 1 (Fig. 3, b). The variation is most pronounced at Golomyannyy with a maximum amplitude of up to 17% in September and a minimum phase of 10° below the norm in August.
In the central part of the sea (Dikson, Izvestiy TSIK, Isachenko, Pravdy islands, Cape Sterlegova), an increase in the annual range of the M2 tide seasonal course both in amplitude and in phase is observed. The most pronounced seasonal course occurs at Dikson where the tide amplitude increases by 24% and the phase decreases by 25° from the norm in August (Fig. 3, c). We note the anomalous annual course of the amplitude at Sterlegova point where it reaches a maximum in May with a deviation from the norm of 11%. However, at the same time the phase seasonal course has a classical form and its decrease (by 19° below the norm) occurs in September. At the Izvestiy TSIK and Pravdy points the amplitude seasonal course also follows anomalous type 2.
Finally, a decrease in the range of seasonal fluctuations in the M2 tide amplitudes and phases is mainly observed in the southeastern part of the sea and in the Vilkitsky Strait (Fig. 3, d). The amplitude increase at Heiberg point does not exceed 7% of the average annual norm and in the Vilkitsky Strait at Chelyuskin, the seasonal course is generally of an uncertain nature (the values are not higher than the SD limits). However, the course of the M2 tide phase curves demonstrates a classical form in all points: a decrease in the phase values is generally observed in September, it is weakly noticeable in summer at Solnechnaya point and is practically absent at Chelyuskina (the value does not exceed SD).
In general, an increase in the amplitudes of the M2 semidiurnal tide in the Kara Sea in summer period (July–September) is mainly 7–12% of the norm and their decrease in winter period (March–April) reaches 8–11% relative to the norm.
In the seasonal variation of phases of the semidiurnal M2, S2, N2 tides, common features are observed: annual periodicity exists everywhere while in the variation of phase curves, the maxima (March–April) and minima (August–September) practically coincide.
In general, according to the classification proposed in [11], classical type 1 of the M2 tide seasonal course with the maximum amplitude and minimum phase in July–September is mainly observed in the Kara Sea area (74% of all cases). Anomalous type 2 accounts for 21% of cases, in one of which (Cape Chelyuskina) no statistically significant seasonal variation of the M2 tide is found.
Does this result indicate confirmation of the widespread hypothesis about the predominant effect of ice cover on the phenomenon of tide seasonal course in the Arctic seas? Not quite so. Drifting and fast ice affects the tide propagation in different ways [10, 30, 31]. Especially strong fast ice effect on the tide occurs in shallow water while at critical depths of 12–15 m and less, the damping and delay are dramatically increased in the winter period [30]. This factor is associated with an increase in the seasonal cycle range at Cape Kharasavey and in the central part of the sea.
Semi-annual periodicity prevails in the seasonal course of the diurnal K1 tide (Fig. 4), however, a combination of annual course in amplitude and semi-annual or annual course in phase can be observed. A period of 3–4 months is observed in a number of points. The moments of occurrence of extreme values of amplitudes and phases do not coincide in time in all cases.
The most consistent type of course between the points is observed at those of the Murmansk Coastal Region (Fig. 4, a). A half-year period in the course of amplitudes and phases exists there; however, a time shift between their maxima is observed. The K1 tide amplitude reaches 13–19 cm, its seasonal course is clearly expressed with the first maximum in March and the second, main maximum up to 12–16% of the norm, in September. The minimum values during the phase are observed in February and a sharply expressed second minimum (6–7° from the norm) – in August.
Different types of the K1 tide amplitude and phase curves are observed in other areas of the Barents Sea. Maximum amplitude deviations from the norm are mainly 10–20%, with phase deviations of 6–16°.
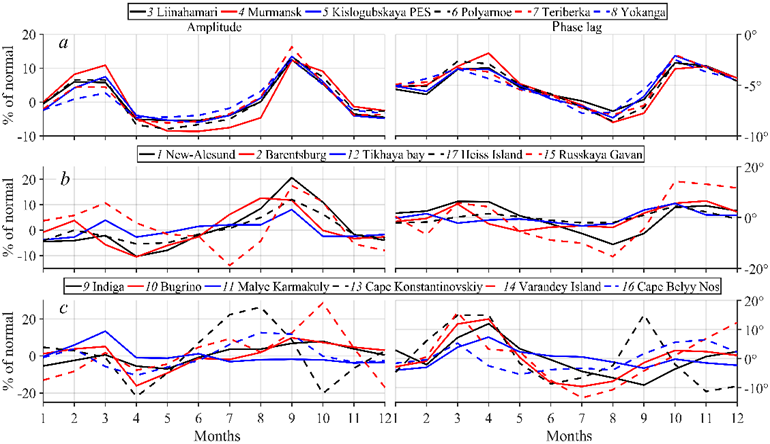
F i g. 4. Seasonal variation of the K1 tide in the Barents Sea
In general, the annual course is poorly expressed in the curves of the seasonal variation of amplitudes and phases of the diurnal K1 tide or the shape of the curves becomes uncertain due to the presence of shorter periods. According to the classification from [11], type 1 of the seasonal variation of the K1 tide dominates in the Barents Sea and accounts for 76%. It should also be noted that the same seasonal course type of the constants of the K1 and O1 tides is observed only at three points.
As follows from the assessment of the M2 tide seasonal course in the Barents Sea, no correspondence between type and nature of the curves course of the diurnal K1 tide and the semidiurnal tide takes place. Preliminary analysis of the data does not reveal any dependence of the seasonal course of diurnal tides on the ice cover impact [10].
The appearance of curves in Fig. 5 indicates the seasonal course of the amplitudes and phases of the K1 tide in the annual cycle in the Kara Sea, demonstrating a large variety. It is appropriate to recall here that not all extremes have significant estimates (above the confidence intervals based on SD). In general, the semi-annual periodicity in the course of the amplitude and phase curves, which is 68%, predominates. At the same time, the time of the onset of extremes in the amplitude and phase at individual points does not coincide.
The K1 tide seasonal variation in amplitude and phase is most pronounced in the southwestern part of the sea and its southern central part. Moreover, the first amplitude maximum in the southwestern part is somewhat blurred in time, it is observed in January – March and accounts for 7–10% of the norm; the second one, main maximum, is traced in September and reaches 30–33% of the norm. However, the minima are not manifested in the phase so clearly and sometimes a period of 3–4 months occurs. In the southern central part, the first amplitude maximum is observed in February – March with 10–13% of the norm, and the second one, main maximum, is unstable in time, occurs in June–October and reaches 15–20% of the norm.
F i g. 5. Seasonal variation of the K1 tide in the Kara Sea
Large amplitudes, on average up to 10–15% of the norm, are observed in the southwestern and northern Kara Sea as well as the phases of up to 5–10°. In the southeastern part of the sea, extrema in the amplitude seasonal course do not exceed, on average, 5–10% of the norm and the phases are about 3–6°. Minimum values are noted in the Vilkitsky Strait.
The main conclusion from the assessment of the results of the K1 diurnal tide seasonal course coincides with that concerning the Barents Sea made above. Seasonal variations of the semidiurnal M2 tide and the diurnal K1 tide are different. The obtained results make it possible to speak confidently about different physical nature of seasonal course formation of semidiurnal and diurnal tides [10].
No correspondence between the seasonal course curves of the amplitudes and phases of the diurnal K1 and O1 tides as well as between the curves of the semidiurnal tides was observed.
In [10], a simple analytical model explaining the seasonal course causes of the diurnal K1 and O1 tides was considered. As demonstrated in this work, in the harmonic analysis of monthly series, when isolating the K1 tide in the second approximation, a standard separation by theoretical relations is used. In this case, the influence of the S1 tide, which is close in angular velocity to the P1 tide, is not taken into account. The contribution of the secondary S1 tide can reach 6–8% of the main K1 tide amplitude. If we separate the K1 and P1 tides from the annual series by real relations, i.e. if we perform demodulation, then the seasonal course may acquire an implicit form. Here, it should be borne in mind that a similar technique was applied in [10] to reduce the harmonic constants of the K1 tide, obtained from the monthly series, to the average annual values.
A natural question about the difference degree between the “true” data and the data presented in our work on the K1 tide seasonal course may arise. We have performed the following assessment. The K1 tide amplitude in the Barents Sea is significantly greater than in the Kara Sea. Based on the results of our analyses of long-term observation series in the Barents and Kara seas, we can say the following: the average amplitude of the K1 tide for 17 points in the Barents Sea is about 12 cm, for 19 points in the Kara Sea – about 3.5 cm; the average ratio of the amplitudes of the P1 and K1 tides in the Barents and Kara seas is 0.296 and 0.334, respectively (the theoretical ratio is 0.331); the phase difference of these tides from observations is on average – 4.2 and – 5.1°, respectively (it is zero in theory).
On the impact of the S1 radiation tide. Its average amplitude for 17 points in the Barents Sea and 19 points in the Kara Sea according to observations is 0.66 and 0.16 cm, respectively. This tide is not involved in the standard division. Its impact on the seasonal course does not affect its structure (the tide can only affect the annual periodicity) but it can slightly weaken or increase the annual period amplitude [10].
It is clear that the standard division results in most points will differ insignificantly from the special division according to the ratios from observations. Therefore, a non-standard division has no practical sense. In general, the results of the K1 tide seasonal course presented in our work satisfactorily describe its structure and type of curves.
Seasonal variation of the O1 tide in the Barents and Kara Seas has mainly a semi-annual periodicity in amplitude and phase, which is 58% of the norm for points in both seas. The difference in the form of the seasonal course curves of the diurnal K1 and O1 tides can be explained by the effect of some minor tides on the results of the O1 tide monthly analyses. The O1 tide group also contains such minor complex tides with significant amplitude as MP1 and MS1, which are not separated in standard analyses of monthly series but can cause semi-annual periodicities in the usual analysis results. In the Barents and Kara seas, according to our results, the average amplitude of the O1 tide is 2.4 and 2.9 cm, respectively. Therefore, consideration of the O1 tide seasonal course is inappropriate for practical purposes.
However, everything is not so clear. In areas where fast ice is formed under shallow water conditions in winter, such as Pechora Bay, the Gulf of Ob and the Yenisei Gulf [10], the seasonal course of diurnal tides manifests itself as an anomalous natural phenomenon.
Despite the fact that the phenomenon of tide seasonal course in the World Ocean was revealed in 1934 [1] and has been known in the Arctic seas since 1936 [2], the tide in domestic and foreign tide tables is precalculated using the old classical method without taking into account the seasonal variation of semidiurnal and diurnal tides in the annual cycle. A qualitative turn in numerical modeling has occurred in the past decade and some tide models in the 21st century take into account the seasonal course of semidiurnal tides in the Arctic Ocean [32].
Conclusion
Based on the analysis results at 36 points in the Barents and Kara seas, in this work we have considered the seasonal course features of semidiurnal tides using the example of the М2 tide and diurnal tides using the example of the К1 tide. In general, the seasonal course range of tides in the Barents Sea increases from north to south and it is most significant in the southeast of the sea.
In all six points of the Murmansk Coastal Region (from Liinahamari to Yokanga), the seasonal variation of the М2 tide amplitude has an identical shape of curves. An annual periodicity with a maximum amplitude in August with an increase of 3–4% from the average annual norm and a minimum phase in March with a decrease of only 1–2° from the norm is observed. According to the new classification of the seasonal variation of semidiurnal and diurnal tides, anomalous type 3 seasonal variation is observed in this region.
Seasonal variation range is weakly expressed in the northern Barents Sea on Spitsbergen Island (New Alesund and Barentsburg points). In the annual cycle, the amplitude increase in June is only 0.8–0.9% of the norm and the decrease in phase in September is about 1°. The seasonal variation proceeds here according to anomalous type 2.
The greatest differences in the type of curves of the М2 tide seasonal course and the most extreme values of amplitudes and phases are observed in the southeastern part of the Barents Sea in the Kanino-Pechora Region. The most pronounced anomalous seasonal course of the М2 tide is noted in Pechora Bay. The maximum amplitude of up to 31% of the norm and the minimum phase of up to 11° below the norm are recorded at point Konstantinovskiy in July.
Classical type 1 of the M2 tide seasonal course is not predominant and is 35% of the norm; anomalous type 3, reaching 41% of the norm at 17 points, is observed most frequently. This fact can serve as indirect evidence that the ice cover impact is not the predominant factor in the formation of seasonal tide course in the Barents Sea. The exceptions are points located in Pechora Bay where fast ice is formed in winter.
In the Kara Sea, the increase in the amplitudes of the semidiurnal M2 tide in summer (July – September) is mainly 7–12% of the norm and their decrease in winter (March – April) reaches 8–11%.
In the central part of the sea, from Dikson to Pravdy islands where fast ice is formed in winter, an increase in the annual range of the M2 tide seasonal course occurs both in amplitude and phase. The most pronounced seasonal course is observed on Dikson island in August where its amplitude increases by 24% of the norm and the phase decreases by 25º. However, at the points of Izvestiy TSIK, Sterlegova and Pravdy, the seasonal course of the tide amplitude follows anomalous type 2.
According to the proposed classification, classical type 1 of the M2 tide seasonal course is mainly observed in the Kara Sea area with the maximum amplitude and minimum phase in July – September, which is 74% of the norm in 19 points. Anomalous type 2 accounts for 21% of cases, in one of which, at point Chelyuskina, no statistically reliable seasonal course of the M2 tide is recorded.
Common features are observed in the seasonal variation of phases of the semidiurnal M2, S2, N2 tides: annual periodicity is present everywhere while the maxima (March – April) and minima (August–September) coincide practically in the course of the phase curves.
The previously proposed hypothesis about different behavior of semidiurnal and diurnal tides in the annual cycle was confirmed. The exceptions are water areas (the Gulf of Ob, the Yenisei Gulf, etc.) where fast ice is formed under shallow water conditions in winter.
In general, the seasonal course of the K1 tide in the Barents and Kara seas is dominated by the semiannual period which is observed in 76% of cases at points in the Barents Sea and in 68% of cases in the Kara Sea. At the Murmansk coast, where the K1 tide amplitude reaches 13–19 cm, its seasonal course has a clearly defined form with the first maximum in March and the second, main maximum (up to 12–16% of the norm), in September. The minimum values during the phase are observed in February and the ones with a sharply defined second minimum – in August (6–7° of the norm).
Seasonal variation of the K1 tide in amplitude and phase is most pronounced in the Kara Sea in its southwestern and southern central parts. Moreover, the first amplitude maximum in the southwestern part, somewhat blurred in time, is observed in January – March and is 7–10% of the norm, and the second, main maximum, is traced in September and reaches 30–33% of the norm. However, the phase minima are not manifested so clearly, sometimes with a period of 3–4 months. In the southern central part, the first amplitude maximum is observed in February – March (10–13% of the norm) and the second, main maximum unstable in time, appears in June – October (15–20% of the norm).
In general, the phenomenon of semi-annual periodicity in the seasonal variation of the K1 tide does not confirm its correlation with the effect of both drifting ice and water stratification. It is possible that the main factor here is stipulated by the peculiarities of the wind (breeze winds) and radiation regimes in the annual cycle.
It was determined in the works of domestic and foreign researchers that drifting ice cover had no significant effect on the propagation of tides. This conclusion was based on all available observational materials of currents from oceanographic moorings in the Arctic seas up to 1979 and on materials of century-long observations of tides at polar stations in the Barents and Kara seas up to the 1990s.
Based on numerical modeling results, the authors believe that the main cause for the seasonal course of semidiurnal tides is the effect of seasonal variation in stratification at the continental shelf and the next cause is the seasonal variation in the drifting ice cover in the Arctic Ocean.
The new results of seasonal course of semidiurnal and diurnal tides in the Barents and Kara Seas presented in this study, which were obtained by a new methodology in the processing and harmonic analysis of long-term series of sea level observations, make it possible to increase significantly the level of navigation safety and solve a number of economic problems on the Northern Sea Route.
1. Corkan, R.H., 1934. An Annual Perturbation in the Range of Tide. Proceedings of the Royal Society of London. Series A, Containing Papers of a Mathematical and Physical Character, 144(853), pp. 537-559. https://doi.org/10.1098/rspa.1934.0067
2. Wiese, W.J., 1936. Preface. In: I.V. Maximov, 1936. Hydrology. Materials for the Study of the Tides of the Arctic Seas of the USSR. Transactions of the Arctic Institute, vol. 52(2). Leningrad: Glavsevmorput, pp. 5-7 (in Russian).
3. Wiese, W.J., 1939. [Arctic Warming and Tidal Surges]. Arctic and Antarctic Research, (5), pp. 37-42 (in Russian).
4. Maximov, I.V., 1953. [On the Dependence of Tidal Elements on the Sea Ice Cover]. Scientific Notes of the Admiral Makarov Higher Arctic Maritime School, (4), pp. 115-129 (in Russian).
5. Dvorkin, E.N. and Mandel, S.Z., 1989. [On the Influence of Ice Cover on the Variability of Tidal Constants]. Proceedings of the AARI, 414, pp. 76-85 (in Russian).
6. Maximov, I.V., 1949. [Seasonal Fluctuations of the Main Tidal Elements in the Seas of the Soviet Arctic]. Transactions of the Arctic Institute, 13, pp. 5-19 (in Russian).
7. Diesperova, R.A., 1954. [Tides of the Arctic Ocean]. In: SOI, 1954. Proceedings of SOI. Moscow: Gidrometeoizdat, 19, pp. 3-75 (in Russian).
8. Kagansky, A.S., 1965. [Some Features of Variability of Harmonic Constants of Tidal Level Fluctuations]. Proceedings of SOI. Moscow: Gidrometeeoizdat, 85, pp. 84-90 (in Russian).
9. Maximov, I.V., 1941. Principal Methods of Working up Observations of Sea-Currents. Moscow; Leningrad: Glavsevmorput, 332 с. Transactions of the Arctic Institute. Vol. 155, 332 p. (in Russian).
10. Voinov, G.N., 1999. The Tidal Phenomena in the Kara Sea. Saint Petersburg: RGS, 117 p. (in Russian).
11. Voinov, G.N., 2003. New Interpretation of Seasonal Variability of Tides of the Russian Arctic Seas. Russian Meteorology and Hydrology, (9), pp. 59-70.
12. Amin, M., 1983. On Perturbations of Harmonic Constants in the Thames Estuary. Geophysical Journal of the Royal Astronomical Society, 73(3), pp. 587-603. https://doi.org/10.1111/j.1365-246x.1983.tb03334.x
13. Amin, M., 1985. Temporal Variations of Tides on the West Coast of Great Britain. Geophysical Journal of the Royal Astronomical Society, 82(2), pp. 279-299. https://doi.org/10.1111/j.1365-246x.1985.tb05138.x
14. Kulakov, M.Yu. and Legenkov, A.P., 1985. [Poincare Waves under the Ice Cover and on Clear Water]. Proceedings of the AARI, 389, pp. 59-70 (in Russian).
15. Legenkov, A.P., 1965. Reflection of Sverdrup Waves from the Ice Edge. Izvestiia Akademii Nauk SSSR. Fizika Atmosfery i Okeana, 1(3), pp. 327-334 (in Russian).
16. Kowalik, Z., 1981. A Study of the M2 Tide in the Ice-Covered Arctic Ocean. Modeling, Identification and Control, 2(4), pp. 201-223.
17. Kagan, B.A. and Sofina, E.V., 2009. Seasonal Variability of the M2 Tide in the Arctic Ocean. Fundamental and Applied Hydrophysics, 2(4), pp. 31-37 (in Russian).
18. Huess, V. and Andersen, O.B., 2001. Seasonal Variation in the Main Tidal Constituent from Altimetry. Geophysiсal Research Letters, 28(4), pp. 567-570. https://doi.org/10.1029/2000gl011921
19. Kang, S.K., Foreman, M.G.G., Lie, H.-J., Lee, J.-H., Cherniawsky, J. and Yum, K.-D., 2002. Two-Layer Tidal Modelling of the Yellow and East China Sears with Application to Seasonal Variability of the M2 Tide. Journal of Geophysical Research: Oceans, 107(C3), pp. 6-1-6-18. https://doi.org/10.1029/2001JC000838
20. Müller, M., Cherniawsky, J.Y., Foreman, M.G.G. and von Storch, J.-S., 2014. Seasonal Variation of the M2 Tide. Ocean Dynamics, 64, pp. 159-177. https://doi.org/10.1007/s10236-013-0679-0
21. Voinov, G.N., 2007. Seasonal Variability of the Harmonic Constants of the Quarter-Diurnal and Sixth-Diurnal Constituents in the Barents Sea and White Sea. Russian Meteorology and Hydrology, 32(4), pp. 252-261. https://doi.org/10.3103/S106837390704005X
22. May, R.I., 2008. Linear and Nonlinear Tidal Phenomena in the Euro-Arctic Seas. Arctic and Antarctic Research, 3(80), pp. 115-125 (in Russian).
23. Kulikov, M.E., Medvedev, I.P. and Kondrin, A.T., 2020. Features of Seasonal Variability of Tidal Sea-Level Oscillations in the Russian Arctic Seas. Russian Meteorology and Hydrology, 45(6), pp. 411-421. https://doi.org/10.3103/S1068373920060047
24. Voinov, G.N., 2004. Harmonic Analysis of Tides from Irregular Multilayer Sea Level and Current Observations. Oceanology, 44(2), pp. 156-162.
25. Voinov, G.N., 2009. Harmonic Analysis of Tides from Standard Observations of the Sea Level. Russian Meteorology and Hydrology, 34(7), pp. 464-472. https://doi.org/10.3103/S1068373909070061
26. Voinov, G.N., 2011. Methods for Quality Control and Revision the Multiyear Time Series of Sea Level Observations. Arctic and Antarctic Research, (4), pp. 51-61 (in Russian).
27. Voinov, G.N., 2013. The Quality of the Multiyear Sea Level Data on the Stations System in the Coastal Zone in North-West Seas and in Arctic Seas. Proceedings of the State Oceanographic Institute, 214, pp. 223-236 (in Russian).
28. Voinov, G.N., 2015. A Method for Transforming Hourly Observations of Sea Water Level to Homogeneous Series by Tide Calibration. Arctic and Antarctic Research, (2), pp. 68-80 (in Russian).
29. Komchatov, V.F. and Luchkov, V.P., 2011. Main Coastal Marine Hydrometeorological Stations System as a Basis for Investigations of Russian Federation Shelf Seas Regime and for Securing of Marine Activities Safety. Proceedings of the State Oceanographic Institute, 213, pp. 5-14 (in Russian).
30. Voinov, G.N., 1988. [Tidal Currents of the Arctic Seas]. Proceedings of the Arctic and Antarctic Research Institute, 128, 238 p.
31. Voinov, G.N. and Naumov, A.K., 2017. The Tides in the South-Western Kara Sea. Tides Calibration Method Effects. Arctic and Antarctic Research, (4), pp. 98-115 (in Russian).
32. Lyard, F.H., Allain, D.J., Cancet, M., Carrère, L. and Picot, N., 2021. FES2014 Global Ocean Tides Atlas: Design and Performance. Ocean Science, 17(3), pp. 615-649. https://doi.org/10.5194/os-17-615-2021