


Institute of Marine Geology and Geophysics, Far Eastern Branch of Russian Academy of Sciences
Россия
Россия
Россия
Purpose. This study aims to examine the vertical distributions of temperature, salinity, and geostrophic currents along repeated sections during different seasons, based on oceanographic survey data. Methods and Results. The analysis is based on data from seven surveys conducted in spring (May), summer (July–September), and autumn (November) along four selected transects crossing the shelf and continental slope off the southeastern coast of Kamchatka, the Fourth Kuril Strait, and the Severgin Strait. Variations in the surface heated layer, as well as in the cold and warm intermediate layers, are assessed. It is shown that in spring and autumn, the cold intermediate layer extends throughout the water column, whereas in the deep-sea area, it is underlain by a warm intermediate layer. In autumn, the upper boundary of the cold intermediate layer deepens, likely due to wind-wave mixing. Freshened water (with salinity as low as 31.5 PSU), resulting from ice melt in the Bering Sea, is observed off the southeastern coast of Kamchatka in July. However, salinity in the study area remains generally high. Calculated geostrophic current velocities indicate that a consolidated southwestward flow, extending through the entire water column and most pronounced above the slope, is observed only in spring—likely a remnant of winter circulation patterns. In summer and autumn, currents are more variable, with different directions in different layers and along various parts of the transects. Conclusions. The analysis of oceanographic survey data demonstrates that the underwater Vityaz Ridge significantly influences the hydrological conditions in the Northern Kuril Islands region. Specifically, warm intermediate layer waters weakly penetrate into the northern part of the trough between the ridge and the Kuril Islands, while the cold intermediate layer develops down to depths of 500 m. In this area, current directions often differ from those over the continental slope. Although rare, negative seawater temperatures are occasionally recorded in the cores of the cold intermediate layer. The Kamchatka and Kuril currents are clearly defined in spring and become weaker during summer and autumn.
northern Kuril Islands, seawater temperature, salinity, oceanographic section, Kamchatka Current, Kuril Current, cold intermediate layer, warm intermediate layer
Introduction
The waters of the northwestern Pacific Ocean adjacent to the Northern Kuril Islands constitute one of Russia’s most active fishing zones. Significant amounts of cod, halibut, flounder, saury, and Pacific salmon are harvested in this region. This economic relevance underscores the importance of studying the oceanographic – primarily thermal – conditions, which play a key role in shaping the habitat of marine biota.
In addition to practical relevance, this area is of considerable scientific interest due to the transformation of the Kamchatka Current. Near the Fourth Kuril Strait, the current bifurcates into the West Kamchatka Current, which turns toward the Sea of Okhotsk, and the Kuril Current, which continues southwestward. Investigating the seasonal variability of these currents is particularly important, as they remain insufficiently studied. Moreover, current formation is influenced by the complex bottom topography, especially south of the Fourth Kuril Strait, where the underwater Vityaz Ridge runs parallel to the island chain. Water exchange with the Sea of Okhotsk through the Kuril Straits must also be considered [1].
Due to the remoteness of the region, the Sakhalin branch of VNIRO conducted oceanographic surveys only occasionally – three times in total: in April 2013 and in May 2015 and 2016, as part of ichthyoplankton studies. In contrast, the Pacific branch of VNIRO regularly performs hydrological profiling in this area. However, its analyses have mainly focused on long-term changes in the hydrological regime of the northwestern Pacific Ocean (NWPO) in the context of global warming [2–4].
The most comprehensive surveys of the continental slope off the northern Kuril Islands and southeastern Kamchatka were carried out from 1992 to 2000 during scientific support for industrial fishing by Japanese vessels. Notably, these operations took place outside Russia’s 12-mile territorial zone, covering only a limited portion of the shelf area. Most of these data were summarized by G.A. Kantakov [5], who introduced a useful methodological innovation by selecting a standard section perpendicular to the coast of Paramushir Island. Oceanographic profiling was relatively frequent along this line, allowing it to be treated as a repeatable reference section. This approach enabled analysis of the variability in depth-averaged seawater temperature, salinity, and geostrophic currents. Among 14 analyzed surveys, the strongest Kamchatka Current velocities were recorded in October 1992 (16 cm/s) and in May 1992 and 1995 (10 cm/s), while the weakest were observed during summer (1–5 cm/s).
More detailed studies of hydrological conditions on the shelf and continental slope are presented in [1, 6, 7]. For the present work, we selected data from a substantial number of oceanographic profiles collected during cruises by POI FEB RAS, FERHRI of Roshydromet, and the TINRO-Center, focusing on several cross-sections [6]. Of these, three were particularly relevant, with endpoints located near southeastern Kamchatka, the Fourth Kuril Strait, and the Kruzenshtern Strait. This extensive dataset enabled the construction of generalized vertical distributions of temperature and salinity across seasons, down to depths of 5000 m.
These studies revealed that hydrological conditions along the sections were similar. The vertical structure consisted of a surface-heated layer about 30 m thick, a cold intermediate layer (CIL) down to 250 m, a warm intermediate layer (WIL), and deeper waters. In the cold season, cooling of the surface layer causes the CIL to lose its intermediate character, especially on the shelf, where water temperature becomes uniform from surface to bottom by December. In deeper areas, however, the CIL is underlain by the WIL, which persists year-round.
The CIL is a key feature of the hydrological regime not only in the study area but across the NWPO as a whole [8, 9]. As shown in [10], CIL waters originating from both the Bering Sea and the Sea of Okhotsk are transported southwestward along the Kuril Island chain.
This study follows a similar approach to that in [5, 6], selecting four sections in different parts of the study area, closely aligned with the positions in [6] (discussed in detail below). Vertical profiles of temperature, salinity, and geostrophic currents were analyzed along these sections.
We also reference [11], which examined monthly average anomalies of sea surface height (mean dynamic topography) in the Sea of Okhotsk and adjacent waters, including the northern Kuril region. These surfaces were derived from TOPEX/Poseidon satellite altimetry data collected over a 10-year period (September 1992 to October 2002), and used to calculate gradient currents for different seasons.
The most intense water circulation in the study area occurs during winter. In this season, sea level is higher near the coast and lower in the open ocean, corresponding to a well-defined Kamchatka Current, which partially flows into the Sea of Okhotsk (mainly through the Fourth Kuril Strait, and to a lesser extent through the Severgin Strait), forming the West Kamchatka Current. Another branch continues southwest along the Kuril chain as the Kuril Current. The main flow of the latter bypasses the Vityaz Ridge from the east, diverted offshore from the island chain.
In spring, sea surface height gradients weaken across the region, and the Kamchatka and Kuril currents become less distinct, with the West Kamchatka Current nearly disappearing. Multiple eddy structures emerge, generating multidirectional flows and scattered, chaotic circulation. In summer, sea level in the shelf zone off southeastern Kamchatka and the northern Kuril Islands is lower than in the open ocean and the deep trench area, though the gradients remain weaker than in winter. A northeastward flow develops over the continental slope, some distance offshore.
This summer pattern of low coastal sea level persists into autumn, likely driven by prevailing northwesterly winds associated with the winter monsoon. A northeastward current continues to be observed above the continental slope, while the Kamchatka and Kuril currents remain weak.
It is important to note that [11] analyzed sea level anomalies relative to an average surface representing long-term, slowly varying currents. Nevertheless, comparing this broader view with in situ oceanographic data on specific cross-sections remains valuable. Despite significant intra-annual [12, 13] and interannual [14, 15] variability in hydrological conditions, circulation, and sea level, such comparisons offer key insights.
This study places particular emphasis on the influence of the Vityaz Ridge in shaping hydrological conditions south of the Fourth Kuril Strait – especially within the poorly studied trough between the ridge and the Kuril Islands.
Thus, the objective of this work is to investigate the vertical distributions of temperature, salinity, and geostrophic currents along repeated sections across different seasons, using oceanographic survey data.
Observation materials and research methods
Between 1992 and 2000, 25 oceanographic surveys were conducted over the shelf and continental slope of the northern Kuril Islands: one in winter (December) and eight in each of the other seasons. Observations were performed to depths of 1000 meters or to the seabed in shallower regions using an Alec Electronics oceanographic probe.
To analyze current variability, seven of the most detailed surveys were selected from the total of 25. These included several repeated cross-shelf sections, which were consistently surveyed in each of the selected studies (see Table).
Fig. 1 illustrates the locations of the selected sections in relation to the oceanographic stations occupied during the cruise from April 30 to May 3, 1996. Two of these sections were situated off the southeastern coast of Kamchatka – one near the southeastern tip of the peninsula, close to the First Kuril Strait. The third was positioned near the Fourth Kuril Strait, which separates the islands of Paramushir and Onekotan. The fourth was located in the area of the Severgin Strait, between the islands of Kharimkotan and Shiashkotan. These sections can be considered standard; while station coordinates were not fixed precisely, they remained closely aligned across surveys.
Oceanographic surveys in the region of the northern Kuril Islands
|
No. of cruise |
Year |
Period |
Number of CTD-stations |
Depth range, m |
|
1 |
1994 |
14–19 July |
91 |
189–784 |
|
2 |
1994 |
10–15 September |
48 |
196–794 |
|
3 |
1995 |
27–30 August |
74 |
178–833 |
|
4 |
1996 |
30 April – 3 May |
80 |
197–810 |
|
5 |
1996 |
10–15 July |
77 |
200–750 |
|
6 |
1996 |
4–7 September |
83 |
192–705 |
|
7 |
1998 |
15–26 November |
100 |
80–683 |

F i g. 1. Location of oceanographic stations occupied on April 30 – May 3, 1996. Red lines indicate the positions of the selected sections
This made it possible to examine the features of oceanographic conditions and, most importantly, the velocity and direction of geostrophic currents near the northern Kuril Islands in different seasons (excluding winter). Most of the selected surveys were conducted during the warm season: two (in July and September) in 1994 and 1996, one in August 1995, one in spring (April – May 1996), and one in autumn (November 1998). It should be noted that in the Far Eastern seas, September is generally considered part of the summer season due to its warm thermal conditions, second only to August. Therefore, the autumn oceanographic conditions could only be assessed using data from the November 1998 cruise.
It is important to note that estimates of geostrophic currents can be influenced by strong diurnal tidal currents, which, as shown in [16], occur in this region due to the presence of trapped shelf waves.
Given the number of surveys and their uneven monthly distribution, it was difficult to draw definitive conclusions about the seasonal and interannual variability of alongshore currents in the study area. Furthermore, as noted earlier, the surveys were carried out beyond the 12-mile zone and almost entirely excluded the shelf area. Nevertheless, despite these limitations, the findings remain of significant interest. Vertical distributions of temperature, salinity, and geostrophic current velocity along the selected sections, based on the oceanographic survey results, are discussed below. These distributions were produced using OceanDataView, a specialized software tool for processing oceanographic data (available at: odv.awi.de). In this software, current characteristics are derived from the differences in dynamic height between adjacent oceanographic stations. Dynamic heights were calculated at each depth level (after interpolation to a standard 5-meter depth step). The resulting geostrophic velocities are representative of the midpoints between the paired stations.
A brief note on the bottom topography of the study area: it differs markedly between the northern and southern parts. In the north – off the southeastern coast of Kamchatka and near Shumshu and Paramushir Islands – there is an extended, relatively shallow shelf followed by a steep continental slope descending into a deep-sea trench. In contrast, in the southern region, near Onekotan, Kharimkotan, and Shiashkotan Islands, the shelf is shorter and deeper. Approximately 100 km offshore lies the Vityaz Ridge, which terminates near the southern tip of Paramushir Island. Between the islands and the ridge lies a unique trough, with depths ranging from 1500 m in the south to 300 m in the north. These bottom topography features have a significant influence on the formation of hydrological conditions and the pattern of water circulation in the study area.
Results and discussion
Survey on 30 April – 3 May 1996. The oceanographic studies conducted in late April and early May are of particular interest, as they represent the only data from early spring, a period when circulation patterns characteristic of the winter season may still be present. As mentioned earlier, during the cold season, all elements of the anticyclonic circulation system in the Sea of Okhotsk become more pronounced [11]. In particular, a steady southwesterly flow is observed in the study area.
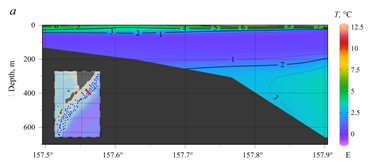
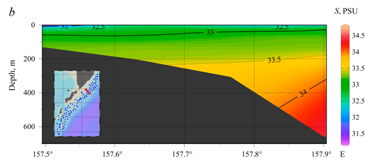
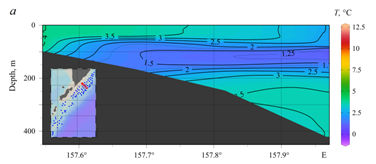
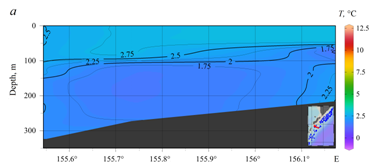
In the vertical temperature distribution along the northernmost section 1 (Fig. 2), initial signs of surface layer warming are visible, but only in the central and eastern parts of the section (up to 2.5 °C). The cold intermediate layer (CIL) is well pronounced, although its temperature exceeded 0.5 °C throughout the section. As noted in [6], the CIL loses its intermediate-layer characteristics over the shelf during the cold season, and the water column becomes vertically homogeneous. However, in the eastern part of the section, it is underlain by the warm intermediate layer (WIL), and a surface-heated layer is already beginning to form.
The boundary between the CIL and WIL – conventionally marked by the 3 °C isotherm – is clearly seen in the eastern deep-water part of the section. It deepens to around 280 m at the edge of the section and reaches the continental slope at a depth of approximately 400 m. The highest seawater temperature (3.5 °C) was recorded at the station furthest offshore, at a depth of about 350 m.
No very low salinity values typically associated with freshwater inflow from the Bering Sea were observed in this section, suggesting that such waters had not reached the area during the observation period. The 33 PSU isohaline was found at a depth of about 100 m, dipping to 200 m in the western part of the section. Maximum salinity values exceeding 34.5 PSU were recorded at depths of about 600 m.
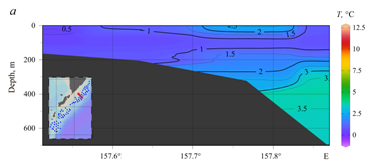

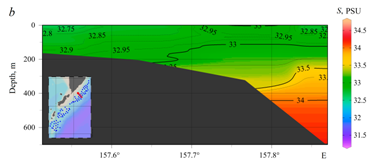

F i g. 2. Vertical distributions of seawater temperature (a, d), salinity (b, e), and geostrophic currents (c, f) along sections 1 (left) and 2 (right) in May 1996
Water stratification was well developed, with density anomaly values ranging from 26 to 30 kg/m³. In the lower layers, upward-sloping isopycnals were observed in the eastern part of the section. A southward flow was present along the entire section, with maximum velocities near the eastern boundary. The velocity decreased westward and with depth, reaching zero near the bottom.
Oceanographic conditions in section 2 were similar to those in section 1 (Fig. 2). In the upper layer, signs of warming were observed only in the eastern part, and these were weaker, with maximum temperatures around 1.5 °C.
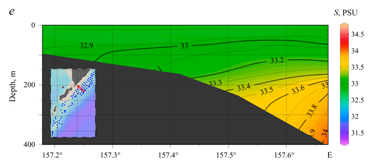
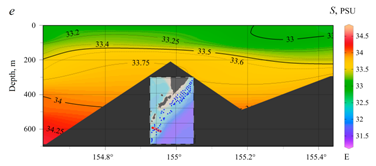
Signs of surface layer warming along section 3 were as weak as those observed along section 2. A small area with temperatures reaching up to 3 °C in the eastern part of the section may be considered such a sign (Fig. 3). The minimum temperatures within the cold intermediate layer (CIL) were about 0.7 °C. Warmer water appeared below 300 m, and maximum temperatures exceeding 3.5 °C were found near the eastern edge of the section.
The salinity distribution was similar to that observed in the previously discussed sections. Very low salinity values were not detected, but the 33 PSU isohaline was found slightly deeper – at about 200 m. At depths below 350 m, salinity exceeded 33.5 PSU, reaching 34 PSU at the eastern boundary.

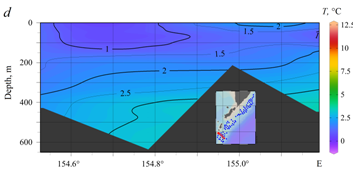

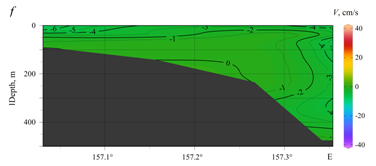
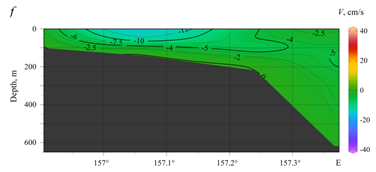
F i g. 3. Vertical distributions of seawater temperature (a, d), salinity (b, e), and geostrophic currents (c, f) along sections 3 (left) and 4 (right) in May 1996
Variations in isotherms and isohalines occurred in the area of the underwater ridge, though they were not as pronounced as in some other surveys discussed later. The most likely cause of changes in oceanographic parameters near this bottom feature is tidal mixing, as diurnal shelf waves generating strong tidal currents have been identified in this area [16].
The slopes of isopycnals in the upper 200-m layer were insignificant, becoming more noticeable at greater depths, particularly east of the underwater ridge. Here, a well-defined southward flow with a maximum speed of 25 cm/s was observed near the section boundary. On the western side of the ridge, the currents were weak and mainly northward-oriented, turning southward near the boundary.
Along section 4, only the earliest signs of surface layer warming were also observed. Two small areas with temperatures up to 1.5 °C were identified. One of them, located at the eastern edge of the section (Fig. 3), extended down to depths of 50–80 m. In the eastern part, cold water with a temperature slightly below 1 °C reached the surface. The warmest water (above 3 °C) was concentrated in the bottom layer. Current velocities throughout most of the section were negative (indicating southward flow along the coast) and relatively weak (up to 5 cm/s).
Thus, in late April to early May 1996, the Kamchatka Current remained strong and was primarily observed over the continental slope. The Kuril Current, which was also evident over the western slope of the deep-sea trench, showed varying intensity along sections 3 and 4 – it was weaker in the latter. A weak northward flow was noted on the western side of the Vityaz Ridge, consistent with the findings of [11].
Survey of 14–19 July 1994. In the northern Kuril Islands region, July marks the beginning of the summer season when a thin, warmed surface layer starts to form, although temperatures are still far from seasonal maxima. Here, we examine the results of an oceanographic survey conducted in mid-July 1994 in greater detail.
By mid-July, the thin surface layer had warmed to 5–6 °C. According to the survey data, a distinct cold intermediate layer (CIL) was observed between 50 and 200 m, with temperatures below 2 °C, increasing to 3.5–4 °C at depths exceeding 250 m. The surface layer was characterized not only by higher temperatures but also by low salinity. In the western part of the section, salinity values in the thin surface layer were particularly low for the region – 31.5 PSU or less.
The most probable cause of this low-salinity water near the southeastern Kamchatka shelf is the influence of melting ice from the southwestern Bering Sea and meltwater runoff through the Kamchatka Strait. Runoff from the rivers of the Kamchatka Peninsula may have also contributed, though the estuary of the main river lies far from the section under consideration, making this influence less likely.
The 33 PSU isohaline was found at a depth of 60–65 m in the western (coastal) part of the section, rising to 50 m in the eastern part. Water with salinity over 33.5 PSU was found at depths below 200 m.

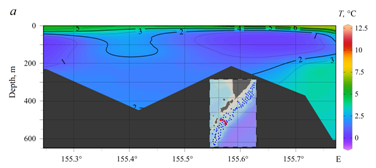
F i g. 4. Vertical distributions of seawater temperature (a, d), salinity (b, e), and geostrophic currents (c, f) along sections 1 (left) and 2 (right) in July 1994
The calculation of currents showed that a southward flow was observed throughout the section, with its maximum velocities (up to 10 cm/s) recorded at depths of 100‒250 m near the eastern edge of the section, above the continental slope; its values decreased rapidly with depth as well as from east to west.
The nature of temperature and salinity vertical distributions on section 2 is similar to that discussed above on section 1 (upper heated layer, well-defined CIL, freshened water in the surface layer), primarily in the western part of the section (Fig. 4).
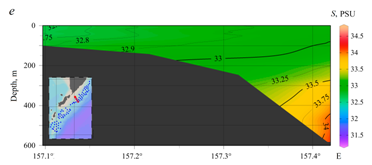
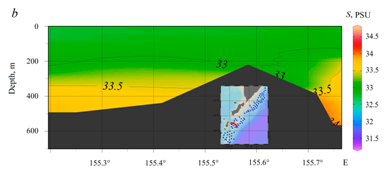
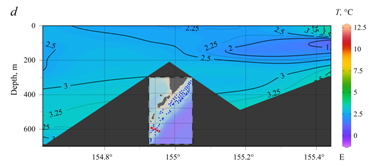
At the edges of the section and at depths over 200 m (over 150 m in the shallow part), the flows were directed southward, while in the central part of the section in the upper 150-m layer – northward. Maximum velocities of about 5 cm/s were recorded here; the southern component reached its maximum at the western edge of the section (up to 8 cm/s). In general, current velocities were small and did not exceed 2 cm/s. On section 3, the nature of temperature and salinity distributions differed from those considered above on the sections related to the southeastern coast of Kamchatka (Fig. 5). Here, warmer and less saline water was observed in the eastern part of the section; in general, the ridge effect on the distribution of oceanographic parameters was very pronounced. At the same time, WIL was practically absent between Onekotan Island and the Vityaz Ridge, with the CIL reaching a depth of about 500 m (its core with negative seawater temperature values was located above the ridge). The 33 PSU isohaline passed almost parallel to the 4 °C isotherm but at a slightly greater depth. High salinity values west of the underwater ridge do not allow the significant thickness of the CIL to be associated with the effect of Sea of Okhotsk water, the salinity of which does not reach such values.

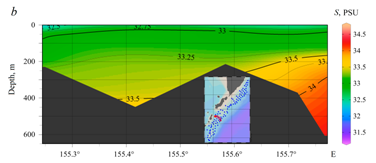
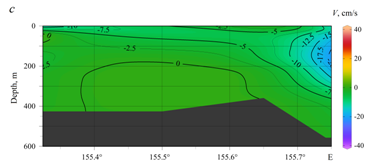
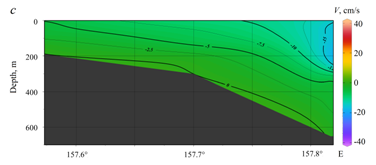
F i g. 5. Vertical distributions of seawater temperature (a, d) and salinity (b, e) as well as geostrophic currents (c, f) on sections 3 (left) and 4 (right) in July 1994
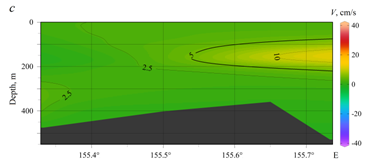
In the eastern part of the section, a uniform southward flow was observed; the highest velocities (up to 15 cm/s) occurred in the depth range from the surface to 250 m. In the western and central parts, the coastal flow was directed northward, with maximum velocities reaching 10 cm/s.
The lowest temperature and highest salinity values of seawater were recorded at the southernmost section 4. In the thin heated surface layer, the temperature fluctuated between 3 and 4 °C and reached 6 °C only at the easternmost station. The CIL had significant thickness, especially in the western part of the section (depth range from 50 to 500 m). In the eastern part, its lower boundary varied from 300 to 200 m in the easterly direction, with the coldest water (temperature less than 1 °C) recorded at the easternmost station. At the same station, the least saline water (down to 32.5 PSU) was also observed in the surface layer, although, in general, water with a salinity of more than 33.5 PSU predominated on the section, and at depths over 300 m – more than 34 PSU.
At the edges of the section, northward flows were observed, and the flow was very intense in the western part, with velocity reaching 20 cm/s (up to 5 cm/s in the eastern part). In the central part of the section, a southward flow was indicated. At depths over 200 m, the currents were insignificant, except at the western edge of the section.
Survey on 10–15 July 1996. Another survey was carried out at approximately the same time in 1996. In the vertical distribution of seawater temperature on sections 1 and 2, a thin heated layer with temperatures up to 6–7 °C stood out, also characterized by low salinity values of less than 32.5 PSU. A southward flow with low velocities, increasing to 10 cm/s at the eastern boundary, was observed throughout the section.
Temperature and salinity vertical distributions on section 3 were noticeably affected by the underwater ridge. The thin heated layer above it was almost absent, and the CIL had a greater thickness in the western part of the section, where the 2 °C isotherm passed near the bottom. In the eastern part, the 3 °C isotherm, taken as the CIL lower boundary, rose from a depth of about 300 m to 200 m towards the edge of the section. Geostrophic currents were multidirectional: northward in the western part of the section and southward in its eastern part.
On section 4, thermal conditions were colder than in other parts of the study area. The heated layer had maximum thickness and temperature (up to 4 °C) in the western part of the section. Northward currents, more pronounced in the western part, were observed along the edges of the section, with maximum velocity reaching 20 cm/s. Current velocity decreased to zero at a depth of about 200 m.
Survey on 27–30 August 1995. Three surveys can be attributed to the period of maximum water warming in the study area: they were carried out at the end of August 1995, in the first ten days of September 1996, and the second ten days of September 1994. In summer 1995, high surface temperature values of 11–12 °C were noted throughout most of the study area, except for the zone near the Severgin Strait, where section 4 passes. However, the heated layer was very thin, about 10 m, and a well-defined CIL was located beneath it; in the northern section, its boundaries were at depths of about 15 to 250 m. A band of negative temperatures was found along the entire length of the section, which is quite rare and unexpected during the period of maximum warming. According to a more fragmentary survey in May 1995, water with negative temperatures in the 20–100 m layer was also observed at most stations, suggesting that the winter of that year may have been abnormally cold in the northwestern Pacific Ocean. Geostrophic currents with low velocities were differently directed in the central and eastern parts of the section.
In the southern part of the study area, on sections 3 and 4, CIL cores with negative temperatures were also identified at the edges of the sections. In deeper layers, relatively warm water was concentrated at the eastern and western boundaries of the sections and at the western slope of the Vityaz Ridge. No CIL was observed in the trough; the 2 °C isotherm reached the bottom.
A weak southward flow was found at the western edge, and a northward flow was observed in the central and eastern parts (on different sides of the ridge). Current velocity was close to zero in the rise area.
Survey on 4–7 September 1996. In the first ten days of September 1996, thermal conditions in the study area were unusually cold for this time of year – this was the main feature revealed by the oceanographic survey. The heated layer was very thin, almost absent in the western part of sections 1 and 2, and weakly expressed in the eastern part of sections 3 and 4 (the maximum temperature in the entire area was about 8 °C). The CIL thickness decreased towards the open ocean; in the southern sections west of the rise, it reached the bottom (no WIL was observed).
In the western part of sections 3 and 4, a pronounced southwestward flow was observed in the trough between the Vityaz Ridge and the Kuril Islands; elsewhere, current velocities were low.
Survey on 10–15 September 1994. In the second ten days of September, surface seawater temperature had a complex spatial distribution: on section 1, warmer water was found near the shore, while on the other sections, it was located in the deep-water part. Spatial differences decreased with depth, and the CIL occupied its usual position at depths of 50 to 250 m in the northern part of the area. On section 3, west of the Vityaz Ridge, it extended down to the bottom; on section 4 – to a depth of 500 m and was underlain by WIL. Negative temperatures occurred in the CIL core at the eastern boundary of the southern sections. Salinity distributions were normal; currents were multidirectional and of low magnitude.
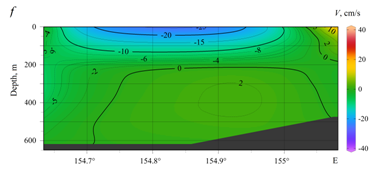
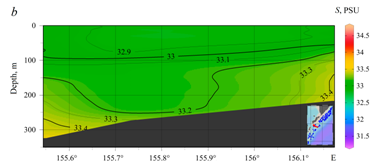
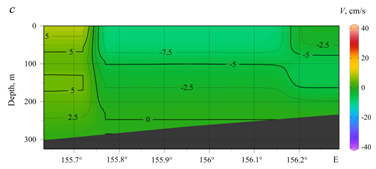
Survey of 15–26 November 1998. The results of soundings carried out in the second half of November were the most representative of the cold season among all expeditions under consideration, which made them particularly valuable. The vertical distribution of seawater temperature on sections 1 and 2 (Fig. 6) shows that the surface layer had cooled to 2.5–4 °C (with increasing values from east to west). The CIL was well developed and occupied the water column at typical depths from 50 to 200 m. Temperature in the cores was slightly higher than usual – over 1 °C.
The salinity distribution was characterized by relatively low values. The 33 PSU isohaline was located quite deep (70–80 m), and salinity values above this level were observed in the western part of the section. The 34 PSU isohaline was found at depths greater than 400 m, and values above this threshold were observed only in small areas. The currents were directed southwestward throughout the sections but had relatively low velocities. This indicates that the Kamchatka Current had not yet been activated by the time of the survey.


F i g. 6. Vertical distributions of seawater temperature (a, d), salinity (b, e), and geostrophic currents (c, f) along sections 1 (left) and 2 (right) in November 1998
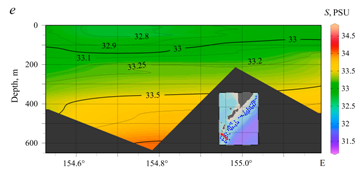
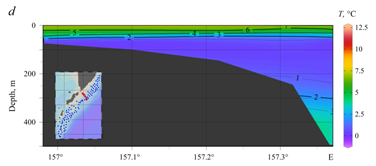
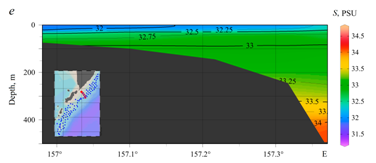
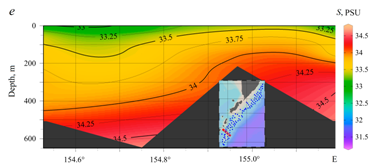
In the southern part of the study area, the surface layer was further cooled to 2–3 °C. The CIL reached the surface across most of section 4 and extended to the bottom along section 3, while no WIL was observed (Fig. 7). Salinity values were relatively low; values around 33.4 PSU were recorded only in the deepest areas at the edges of the section. Across most of the section, salinity varied within a narrow range of 32.8–33.2 PSU. The velocities of the multidirectional currents were relatively low. The autumn–winter intensification of both the Kuril and Kamchatka Currents had not yet occurred.
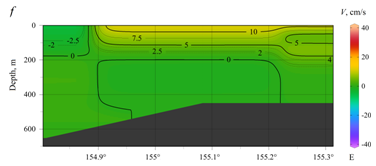
F i g. 7. Vertical distributions of seawater temperature (a, d), salinity (b, e), and geostrophic currents (c, f) along sections 3 (left) and 4 (right) in November 1998
Let us summarize the results of the study aimed at assessing the intensity of the Kamchatka Current near the southeastern coast of Kamchatka and in the zone where it transforms into the Kuril Current. In sections 1 and 2, which represent the Kamchatka Current prior to its bifurcation zone, the most distinct flow was observed in late April–early May; the expected intensification in the second half of November 1998 was not detected. In July, the southward flow persisted, while during the period of maximum surface heating in August–September, geostrophic currents were weak or even northward-directed in some areas of the sections. Typically, the core of the current was observed above the continental slope in the eastern part of the sections.
In the southern part of the study area, the bottom topography – particularly the Vityaz Ridge – significantly affected the characteristics of the Kuril Current, with contrasting oceanographic conditions on either side. Notably, WIL was weakly developed in the trough between the ridge and the islands. In the northern part of this trough (section 3), the CIL reached the bottom in most cases – i.e., to depths of around 500 m – which is considerably deeper than in the Kamchatka region. In the southern part of the trough (section 4), WIL was present, but also less developed than over the continental slope.
The currents on either side of the ridge were predominantly multidirectional. The most pronounced southward flow was observed in May 1996 in the eastern part of the section. A similarly complex distribution of oceanographic parameters and current velocities was typical for the southernmost section 4. This is consistent with satellite altimetry data [11], which revealed the complex structure of the Kuril Current: it divides into several multidirectional jets and does not form a consolidated flow, except during the winter season.
Conclusion
Based on data from seven oceanographic cruises, the hydrological regime of a poorly studied region off the Pacific coast of the northern Kuril Islands was characterized along four repeated sections. This allowed for refinement of existing concepts and the acquisition of new results.
During the warm season, the entire water column over the shelf was occupied by the CIL, primarily of Bering Sea origin, with core temperatures that can reach negative values. Below the CIL, in the deep continental slope area, the WIL was present, with an average upper boundary at 250 m depth (3 °C). In autumn, due to intensive cooling and wind-wave mixing, the upper boundary of the CIL began to deepen until an upper mixed layer formed in winter.
Against a background of typical surface salinity values of 32–33 PSU for the northern Pacific Ocean, fresher waters (down to 31.5 PSU) were observed off the southeastern Kamchatka coast in July, resulting from the melting of Bering Sea ice cover.
Although three of the four selected sections were located near straits in the Kuril Chain, the influence of Sea of Okhotsk waters – characterized by lower salinity – was not evident, even in summer, when reduced Pacific inflow through the straits might have allowed for such influence.
The Kamchatka and Kuril Currents were well developed in spring but weakened in summer and autumn. A general southwestern flow, extending throughout the water column and most pronounced above the continental slope, was observed only in spring. During summer and autumn, the current patterns were unstable and characterized by weak, multidirectional flows both in depth and horizontally.
The Vityaz Ridge significantly influenced the thermohaline structure and circulation in the study area. In particular, WIL waters penetrated only weakly into the northern part of the trough between the ridge and the Kuril Islands, whereas the CIL was well developed there down to depths of 500 m. The direction of geostrophic currents over the underwater trough was often opposite to the flow over the continental slope.
1. Bogdanov, K.T. and Moroz, V.V., 2000. Structure, Dynamic and Hydrology-Acoustical Water Characteristics Peculiarities of the Kuril Straits Area. Vladivostok: Dalnauka, 152 p. (in Russian).
2. Byshev, V.I., Figurkin, A.L. and Anisimov, I.M., 2016. Recent Climate Changes of Thermohaline Structure in the North-West Pacific. Izvestiya TINRO, 185(2), pp. 215-227. https://doi.org/10.26428/1606-9919-2016-185-215-227 (in Russian).
3. Khen, G.V., Ustinova, E.I., Figurkin, A.L., Zuenko, Yu.I., Novikov, Yu.V., Sorokin, Yu.D. and Gamanyuk, M.V., 2004. Hydrological Conditions of the Northwestern Pacific and the Far Eastern Seas at the Beginning of the 21st Century and Expected Trends. Voprosy Promyslovoi Okeanologii, (1), pp. 40-58 (in Russian).
4. Khen, G.V., Ustinova, E.I. and Sorokin, Yu.D., 2022. Long-Term Changes in Thermal Conditions on the Surface of the Far-Eastern Seas and North-West Pacific and Their Relationship with Large-Scale Climate Processes. Izvestiya TINRO, 202(1), pp. 187-207. https://doi.org/10.26428/1606-9919-2022-202-187-207 (in Russian).
5. Kantakov, G.A., 2000. Oceanographic Regime of the Pacific Shelf and Continental Slope of the Northern Kuril Islands and Its Influence on Distribution of Commercial Fishery Targets. In: B. N. Kotenev, ed., 2000. Commercial and Biological Studies of Fishes in the Pacific Waters of the Kuril Islands and Adjacent Areas of the Okhotsk and Bering Seas in 1992-1998. Moscow: VNIRO Publishing, pp. 54-64 (in Russian).
6. Bogdanov, K.T. and Moroz, V.V., 2004. The Kuril-Kamchatka Current and Oyashio Current Water. Vladivostok: Dalnauka, 141 p. (in Russian).
7. Moroz, V.V., 2011. The Water Thermohaline Structure Peculiarities and Temperature Anomalies Dynamics in the Kuril Island Zone and the Adjacent Areas. Vestnik of the Far East Branch of the Russian Academy of Sciences, 3(157), pp. 96-103 (in Russian).
8. Uda, M., 1963. Oceanography of the Subarctic Pacific Ocean. Journal of the Fisheries Board of Canada, 20(1), pp. 119-179. https://doi.org/10.1139/f63-011
9. Talley, L.D., 1993. Distribution and Formation of North Pacific Intermediate Water. Journal of Physical. Oceanography, 23(3), pp. 517-537. https://doi.org/10.1175/1520-0485(1993)023<0517:DAFONP>2.0.CO;2
10. Zhukov, L.A., 1954. [Fundamentals of the Hydrological Regime of the Kuril Region of the Pacific Ocean]. In: AS SSSR, 1954. The Works of the Kuril-Sakhalin Marine Complex Expedition of the ZIN‒TINRO, 1947-1949. Publishing House of the USSR Academy of Sciences. Vol. 1, pp. 304-390 (in Russian).
11. Shevchenko, G.V. and Romanov, A.A., 2006. [Seasonal Variability in the Upper Layer of the Sea of Okhotsk from Altimetry Data]. Meteorologiya i Gidrologiya, (8), pp. 59-71 (in Russian).
12. Glukhovsky, B.Kh., ed., 1998. Hydrometeorology and Hydrochemistry of the Seas. Vol. IX: The Sea of Okhotsk. Issue 1: Hydrometeorological Conditions. Saint Petersburg: Hydrometeoizdat, 343 p. (in Russian).
13. Moroz, V.V., 1999. [Variability of Hydrological Conditions of the Kuril Islands Region in the Warm Half-Year Due to the Peculiarities of Atmospheric Circulation]. Meteorologiya i Gidrologiya, (12), pp. 88-93 (in Russian).
14. Rogachev, K.A. and Shlyk, N.V., 2005. Multiyear Variability of the Wind Stress Curl and Sea Level in the Kamchatka Current. Oceanology, 45(3), pp. 317-326.
15. Sedaeva, O.S. and Shevchenko, G.V., 2001. Investigation of Seasonal Fluctuations of Sea Level and Atmospheric Pressure in the Area of Kuril Ridge. In: G. V. Shevchenko, ed., 2001. Dynamic Processes on the Shelf of Sakhalin and the Kuril Islands. Yuzhno-Sakhalinsk: IMGiG FEB RAS, pp. 81-93 (in Russian).
16. Shevchenko, G.V. and Romanov, A.A., 2008. Determination of Parameters of Tidal Diurnal Shelf Waves in the Area of the North Kuril Islands from the Satellite Altimetry Data. Issledovanie Zemli iz Kosmosa, (3), pp. 76-87 (in Russian).