Россия
Россия
Institute of Automation and Control Processes
Россия
Purpose. A comprehensive analysis of data regarding sea waves of gravity and infragravity ranges, obtained with the help of a supersensitive detector of hydrosphere pressure variations, was conducted. This detector was installed at a depth of 25 m on the shelf of the Sea of Japan. Methods and Results. The synchronous data of the instrument on infragravity (25 s – 8 min) and gravity (2–25 s) ranges were analyzed, and it was established that the change in the total energy of harmonics in the infragravity range almost always correlates with the change in the total energy of harmonics in the gravity range. However, the total energy of harmonics in the gravity range is always greater than the total energy of harmonics in the infragravity range. A detailed analysis of 629 fragments of the supersensitive detector of hydrosphere pressure variation records reveals a variation in the ratio of the total energy of harmonics of the gravity range to the total energy of harmonics of the infragravity range, varying from 1.16 to 19.70. Conclusions. In the context of the 629 sections of recordings considered, 16 cases demonstrated an anticorrelation between the total energy of the harmonics of the gravitational range and the total energy of the harmonics of the infragravity range. For the remaining 613 cases, the correlation coefficient ranged from 0.81 to 0.96.
sea excitement, gravity range, infragravity range, abnormal behavior, harmonics, supersensitive detector, hydrosphere pressure variations
Introduction
As demonstrated in [1], the change in the total energy of infragravity sea waves (20 s – 8 min) is associated with the change in the total energy of gravity sea waves (2–20 s). The same work also suggested that this testifies in favor of the theory of generation of infragravity sea waves by gravity sea waves. This assertion, however, does not contradict the findings of previously published works, which associate the nature of infragravity sea wave occurrence with gravity sea waves, and those that originate far from or near the shelf inshore [2–4]. Papers [5–7] posit that infragravity sea waves are the cause of the “infragravity noise of the Earth”. However, other authors reasonably attribute the origin of the “infragravity noise of the Earth” to atmospheric processes [8–10]. These seemingly contradictory results suggest that atmospheric and oceanic processes may be the primary sources of oscillations/waves of the corresponding periods. Furthermore, these phenomena have been detected within the range of eigen oscillations of the Earth. However, the present study will focus on variations in the energy balance between gravity and infragravity sea waves, which, as stated in paper [1], are interrelated. This is of particular interest when considering the nonlinear interaction of infragravity and gravity sea waves during the occurrence of “two sisters” and “three sisters” rogue waves, the mechanism of which is described in [11–13].
In the absence of a comprehensive description of the origin of infragravity sea waves, the mechanism of the origin and dynamics of surface gravity sea waves of the wind range is, at first glance, fully spelled out, as for example in [14]. However, when studying the dynamic features of gravity sea waves moving along a sea of finite depth, nonlinear effects emerge. Of particular interest is the behavior of nonlinear gravity sea waves moving along the shelf of decreasing depth [15, 16]. It is evident that a considerable number of unknowns remain in the range of surface gravity sea waves, especially with regard to the emergence of waves of extreme amplitudes. It is also important to note the role of gravity sea waves of extreme amplitudes in generating of infragravity signals, also known as “voice of the sea”, in the near-water atmosphere, previously discovered by Shuleikin in 1935 [17]. These waves are the cause of unique microseisms, or “voice of the sea”, which propagate along the Earth’s crust over long distances from their point of generation.
In this study, the aim is to explore the relationship between the total energy of harmonics in gravity and infragravity ranges, while taking into account the unique characteristics of gravity and infragravity sea wave interaction, and their role in the process of anomalous hydrophysical phenomena emergence.
Materials and methods
In the present paper, we use in-situ data obtained during monitoring works on the registration of changes in hydrosphere pressure on the shelf of the Sea of Japan, using the supersensitive detector (see Fig. 1) described in [18]. Fig. 2 shows the installation diagram of the instrument, which was located on the bottom at a depth of 25 m.
The laser interference device is based on the Michelson equal-arm interferometer, which uses a frequency-blocked gas laser as a light source. The interferometer, together with the compensation chamber and the registration system, is placed in a sealed, corrosion-resistant housing, which is protected by a lattice against difficult operating conditions (rocky or muddy bottom). The housing is constructed in the form of a cylinder, with sealed lids closing the ends. A hermetic connector is incorporated into one cover, enabling the connection of a power cable and data transmission. The second cover contains a sensitive element in the form of an ultra-sensitive sensor, namely a membrane. The membrane is in contact with water on one side, and its second side is part of the interferometer. A rigidly fixed mirror is located at the center of the membrane. The use of the membrane allows the hydrosphere pressure variations to be transmitted directly to the measuring arm of the interferometer, changing its length. In addition to the device itself, there is an air chamber in the protective cage, which is hermetically connected to the compensation chamber of the device through a shut-off valve. When the device is submerged to the working depth, the valve is opened and the pressure inside the compensation chamber is equalized with the external pressure. Upon reaching the desired depth, the valve closes, and an ultra-sensitive sensor begins to register variations in the pressure of the hydrosphere. The registration system then records the change in the interference pattern, and, following preliminary processing, transmits it via a cable line to the coastal observation post in the form of variations in the pressure of the hydrosphere. This design of the device enables measurements ranging from 0 (conditionally) to 1 kHz with an accuracy of 0.24 mPa at depths of up to 50 m. The reduction of noise in photoelectronic equipment, temperature expansion, and the more accurate equalization of the interferometer arms will improve the technical characteristics of the ultra-sensitive sensor. As a result, the operational range can be expanded to 10 kHz, thereby enhancing the precision of measuring variations in the pressure of the hydrosphere to 1.8 µPa.

F i g. 1. Supersensitive detector of hydrosphere pressure variations, inside

F i g. 2. Installation diagram of the supersensitive detector of hydrosphere pressure variations (SSDHPV)
The in-kind data received in real time following pre-processing (filtering, decimation) are located on the recording computer. Thereafter, they are placed in the experimental database. Synchronization of all installations is achieved through the use of a precision clock of the Trimble 5700 GPS receiver with an accuracy of 1 microsecond. Depending on the set tasks, the data were then subjected to further processing (filtering, decimation, spectral processing by the periodogram method or the maximum likelihood method). In this study, the focus was on the data in the range of gravity (2–25 s) and infragravity (25 s – 8 min) sea waves. The boundary between gravity and infragravity ranges was determined at 25 s, as per experimental findings reported in [19], which were obtained for the western part of the Sea of Japan/the East Sea.
Obtained in-situ data and their discussion
The data obtained from the supersensitive detector of hydrosphere pressure variations were preprocessed using a low-pass Hamming filter with a cutoff frequency of 1 Hz, and downsampled to a sampling rate of 2 Hz. Subsequently, the data underwent sequential processing in two stages. At the initial stage, the recording was subjected to high-frequency filtering by a Hamming filter with a duration of 10.000 and a cutoff frequency of 0.0004 Hz. At the second stage, the filtered series was filtered by a high-frequency filter with duration of 5000 and cutoff frequency of 0.002 Hz (8 min 20 s). The duration of the entire series was 18373329 points at a sampling frequency of 2 Hz. The final record of the supersensitive detector of hydrosphere pressure variations, which was subjected to further processing, is shown in Fig. 3.
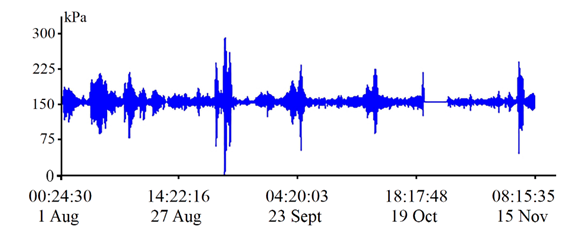
F i g. 3. Filtered record of the supersensitive detector of hydrosphere pressure variations from August 01, 2022 00:24:30 to November 15, 2022 08:15:35 (UTC)
As is evident from this Figure, there were gaps in the instrument’s record associated with power failures. These gaps, naturally, were eliminated during the material analysis. In the course of work, 629 fragments of the record containing reliable data were processed. The processing was carried out as follows. The initial processed dataset began at 04:02:57:00 on 01 August 2022, as there was no power supply during the initial phase of the experiment, i.e. from 00 h 24 min 30.0 s to 04 h 02 min 57.0 s on 01 August 2022. The duration of a single processed fragment was 131072 points, which at a sampling rate of 2 Hz amounted to 18 h 12 min 16 s. The spectral processing was performed by the periodogram method with averaging over 3 points. The subsequent step involved the estimation of total energy across the entire range of gravity and infragravity sea waves. This was followed by the estimation of total energy within two ranges: infragravity and gravity. The gravity range was set from 1 to 25 s, and the infragravity range was set from 25 s to 8 min. In each range, the total energy was determined by integrating the spectra. The duration of the series made it possible to obtain a good frequency resolution, which was equal to 0.000015 Hz. In the subsequent stage, 26214 points were selected (3 h 38 min 27 s) and a similar processing was carried out. All subsequent steps were performed strictly in this sequence. In instances where in-situ data were absent, the corresponding area was bypassed, and the missing data was documented in the information bulletin.
In the domain of gravity range, when processing various fragments from the supersensitive detector of hydrosphere pressure variations, significant peaks were identified across multiple periods. The maximum with the longest period in the gravity range was identified as that with a period of 14.1 s (see Fig. 4), and the maximum with the shortest period in the gravity range was identified as that with a period of 5.7 s (see Fig. 5).
Furthermore, spectral maxima in gravity range were identified in different time intervals at periods ranging from 22.8 to 1.6 s. Consequently, several ranges of the selected periods of gravity sea waves can be identified. The range of periods from 1.6 to 3.6 s is attributed to wind waves of regional significance, which are excited by the wind at the location of the measurement instrument. Finally, waves with periods of 5–6.5 s are identified as background wind waves (background swell waves) of the Sea of Japan. Gravity sea waves with periods ranging from 14 to 15 s belong to the waves excited by the passage of powerful typhoons. Over time, swell waves arrive at the measuring point, successively with decreasing periods (due to dispersion) until they reach background swell waves of the Sea of Japan. These unique gravity sea waves have periods in the range of 22–23 s and could be generated by passing tropical cyclones (typhoons) with unique meteorological characteristics. However, given that waves with such periods, as a rule, do not have great amplitudes (their amplitudes are 10–15 times lower than the amplitudes of the main gravity sea waves), we believe that these gravity sea waves are swell waves of oceanic origin.

F i g. 4. Maximum with the longest period in the gravity range with a period of 14.1 s

F i g. 5. Maximum with the shortest period in the gravity range with a period of 5.7 s
As illustrated in Fig. 6, the dynamic spectrogram of a fragment of the supersensitive detector of hydrosphere pressure variations record depicts several wave ranges simultaneously. Two powerful segments are visible in the infragravity range, and perturbations in the gravity range at periods of 13–14 and 6 s. In the central part of the figure, the periods of gravity sea waves (swell waves) are shown, starting from the period of about 15.5 s and ending with the period of about 7.5 s. These swell waves originated in the Sea of Japan during the passage of a powerful typhoon in this zone. A study of 629 fragments of the record of hydrosphere pressure variations obtained during observations from August 01, 00:24:30 to November 15, 08:15:35 revealed that sea gravity waves with periods ranging from 14.1 to 5.7 s exhibited maximum amplitudes at different times.
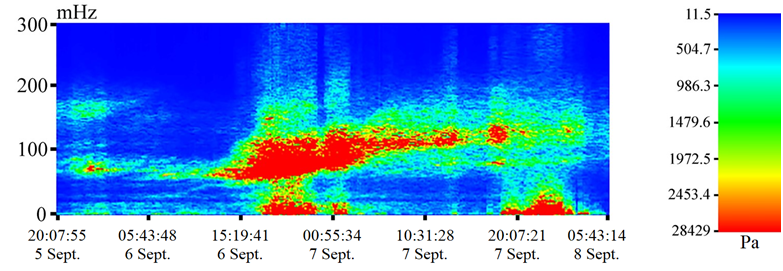
F i g. 6. Dynamic spectrogram of a fragment of hydrosphere pressure variations record from September 05, 2022 20:07:550 to September 08, 2022 05:43:14 (UTC)
When processing all segments, the maximum peak in the gravity range was identified at a period of 12.4 s, with an amplitude of 3757.5 Pa/Hz (see Fig. 7). In accordance with the findings of [14], the amplitude of a surface sea wave can be estimated from the formula
Where a is the wave amplitude; P is registered pressure; h is the depth in the instrument installation point,; λ is the length of the gravity wave; g is gravity acceleration, and ρ is the density of the sea wave. The resultant wave amplitude is approximately 0.4 m, with a corresponding wave height of about 0.8 m. It should be noted that these figures represent an average wave amplitude in the fragment of 65536 s (18 h 12 min 16 s).
When processing the same record, but of a shorter duration (e.g. 2048 s), the amplitude of the same wave is 3.3 m (i.e. the height is 6.6 m), which at this time is very close to the maximum height of the wave created by a passing powerful typhoon in the Sea of Japan. Concurrently with the maximum amplitude of the gravity sea wave at a period of 12.4 s, a high amplitude of the infragravity sea wave is also observed, which is equal to 2921.5 Pa/Hz at a period of 5 min 18.1 s (see Fig. 8). At the same time, the total energy of the harmonics of the gravity range (25–1 s) is much higher than the total energy of the harmonics of the infragravity range (8 min – 25 s). In this case, the former is 5.5 times higher. To enhance the visual clarity of the infragravity range, particularly the higher frequencies, Fig. 8 (and subsequent figures) has been modified by the exclusion of a segment of the graph ranging from 15.6 to 40 mHz, containing mostly non-informative spectral components with considerably smaller amplitudes.
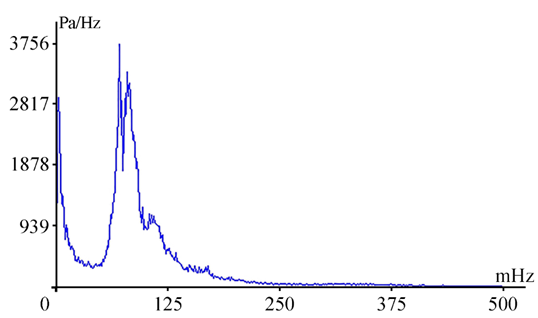
F i g. 7. Amplitude spectrum of the signal of gravity range of the supersensitive detector of hydrosphere pressure variations record fragment

F i g. 8. Amplitude spectrum of the signal of infragravity range of the supersensitive detector of hydrosphere pressure variations record fragment
It is evident that an increase in this ratio generally results in the highest amplitude of one of the harmonics of the gravity range exceeding the highest amplitude of one of the harmonics of the infragravity range. As this ratio decreases, the highest amplitude of one of the harmonics in the infragravity range is usually greater than the highest amplitude of one of the harmonics in the gravity range. Typical examples can be found in Figs. 9 and 10, which illustrate the amplitude spectrum of the signal from the gravity and infragravity ranges of a single fragment of the record of the supersensitive detector of hydrosphere pressure variations.
In the latter case, the total energy of harmonics in the gravity range (25–2 s) is only 1.3 times greater than the total energy of harmonics in the infragravity range (8 min – 25 s), and the largest amplitude of harmonic in the infragravity range is greater than the largest amplitude of harmonic in the gravity range.
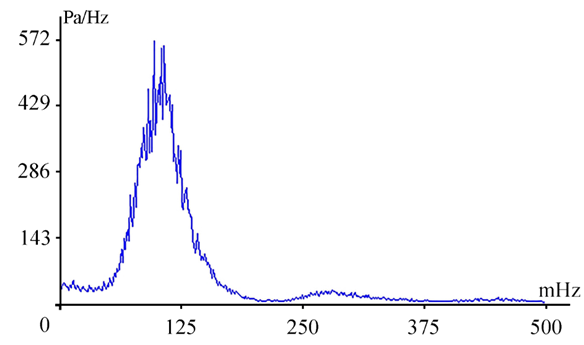
F i g. 9. Amplitude spectrum of the signal of gravity range of the supersensitive detector of hydrosphere pressure variations record fragment (maximum at a period of 6.8 s)

F i g. 10. Amplitude spectrum of the signal of infragravity range of the supersensitive detector of hydrosphere pressure variations record fragment (maximum at a period of 5 min 34.4 s)
When analyzing the situations in Figs. 7–10, the question remains: are the total energies of the infragravity and gravity ranges related, and how are they related? After processing the entire data array, we found that the relationship does exist, and that it is mainly directly proportional, i.e. a decrease in the total energy of the gravity range is accompanied by a decrease in the total energy of the infragravity range, and vice versa – an increase in the total energy of the gravity range is accompanied by an increase in the total energy of the infragravity range. This assertion is supported by the graphs shown in Figs. 11–13.
In rare cases, anomalous behavior of the total energy of the gravity and infragravity ranges is observed. By anomalous behavior we mean the discrepancy (uncorrelated behavior) in the behavior of the total energy of the harmonics of the gravity and infragravity ranges. Pronounced anomalous behavior is observed in the graphs shown in Fig. 14.

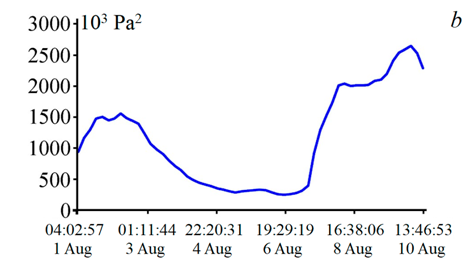
F i g. 11. Graph of change in the total energy of the infragravity (a) and gravity (b) ranges (correlation coefficient 0.96) from August 01, 2022 04:02:57 to August 10, 2022 13:46:53 (UTC)
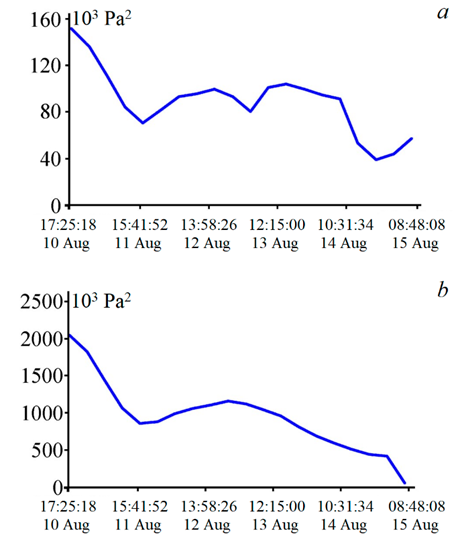
F i g. 12. Graph of change in the total energy of the infragravity (a) and gravity (b) ranges (correlation coefficient 0.88) from August 10, 2022 17:25:18 to August 15, 2022 08:48:08 (UTC)
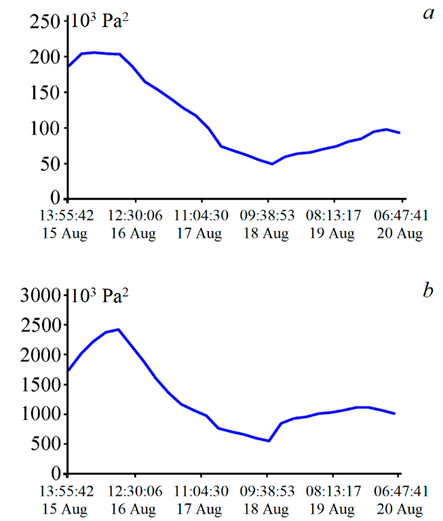
F i g. 13. Graph of change in the total energy of the infragravity (a) and gravity (b) ranges (correlation coefficient 0.96) from August 15, 2022 13:55:42 to August 20, 2022 06:47:41 (UTC)

F i g. 14. Graph of change in the total energy of the infragravity (a) and gravity (b) ranges (correlation coefficient 0.19) from August 20, 2022 21:21:27 to August 24, 2022 09:05:50 (UTC)
As demonstrated by the comparison of the graphs shown in Fig. 14, the behavior of the total energy of the harmonics of gravity and infragravity ranges is observed to be normal on 1/3 of the segment. However, in the remaining 2/3 of the segment, an anomalous behavior of the total energy of the harmonics of gravity and infragravity ranges is observed. How does the anomalous behavior of the total energy of harmonics of gravity and infragravity ranges manifest itself? Firstly, at elevated values, the ratio of the total energy of the harmonics of gravity range to the total energy of the harmonics of infragravity range is substantial, and the maximum peak is not at the harmonic of gravity range, but at the harmonic of infragravity range. As illustrated in the second segment of the graph presented in Fig. 14, this ratio reaches a value of 7.5, and the maximum signal amplitude occurs at the harmonic of infragravity range (4 min 51.3 s (3.43 mHz – amplitude 443 Pa/Hz)). A similar outcome is observed at the ratio of 6.5, where the maximum amplitude is also at the harmonic of infragravity range (4 min 51.3 s (3.43 mHz – 440 Pa/Hz)).
From the series of observations, it is evident that there are other cases of anomalous behavior of this ratio at maximum harmonics of gravity or infragravity ranges. Anomalous behavior of this nature is observed when the ratio of the total energy of the harmonics of gravity range to the total energy of the harmonics of infragravity range is 7.0 (6 min 16.6 s (2.65 mHz – 494 Pa/Hz)), 7.8 (6 min 16.6 s (2.65 mHz – 690 Pa/Hz)), 7.9 (5 min 34.4 s (2.99 mHz – 182 Pa/Hz)), 8.3 (5 min 36.1 s (2.98 mHz – 172 Pa/Hz)), 7.9 (4 min 53.9 s (3.4 mHz – 145 Pa/Hz)), 8.0 (5 min 44.9 s (2.9 mHz – 104 Pa/Hz)), 8.4 (5 min 00.6 s (3.33 mHz – 122 Pa/Hz)). Anomalous behavior has been observed at other ratios. For instance, at the ratio of 3.6, the maximum signal amplitude is observed not at the harmonic of the infragravity range, but at the harmonic of the gravity range, in this case, at the harmonic with a period of 5.8 s (0.172 Hz – 127 Pa/Hz). A similar anomaly is also observed for other ratios, for example, 3.4 (5.8 s (0.172 Hz – 128 Pa/Hz)), 4.8 (12.0 s (0.083 Hz – 267 Pa/Hz)), 4.6 (12.1 s (0.0826 Hz – 260 Pa/Hz)), 4.0 (12.3 s (0.081 Hz – 245 Pa/Hz)), 2.9 (9.3 s (0.107 Hz – 130 Pa/Hz)), 3.0 (12.8 s (0.078 Hz – 272 Pa/Hz)).
We assume that the nature of the observed anomalies is associated with the focusing or defocusing of harmonics of infragravity or gravity ranges, i.e. with a concentration of energy on individual harmonics or diffusion of energy between the harmonics of infragravity or gravity ranges.
Fig. 15 shows the amplitude spectrum of the signal obtained from processing a fragment of the supersensitive detector of hydrosphere pressure variations record, which shows focusing of the infragravity harmonics (see the bottom graph) and defocusing of the gravity harmonics (see the top graph). In this case, the ratio of the total energy of the harmonics of the gravity range to the total energy of the harmonics of the infragravity range is 8.4.
On the contrary, we would say that more anomalous cases are observed when the harmonics of the infragravity range are defocused and the harmonics of the gravity range are focused. As demonstrated in Fig. 16, the amplitude spectrum of the signal from a fragment of the supersensitive detector of hydrosphere pressure variations record exhibits a ratio of the total energy of the harmonics of gravity range to the total energy of the harmonics of infragravity range of 3.1.

F i g. 15. Amplitude spectrum of the signal of gravity range (a) and infragravity range (b) of the supersensitive detector of hydrosphere pressure variations record fragment

F i g. 16. Amplitude spectrum of the signal of gravity range (a) and infragravity range (b) of the supersensitive detector of hydrosphere pressure variations record fragment
Of particular interest are the cases of anomalous situations, where defocusing of the harmonics of infragravity range is observed, subsequently accompanied by focusing of the harmonics of infragravity range. This is followed by interaction of the harmonics of infragravity range with the harmonics of gravity range, resulting in the emergence of anomalous waves of high amplitudes, such as “one sister”, “two sisters”, “three sisters” [20]. An illustration of such a recording section of the supersensitive detector of hydrosphere pressure variations is presented in Fig. 17.
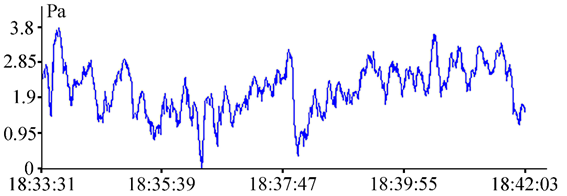
F i g. 17. A recording section of the supersensitive detector of hydrosphere pressure variations for September 2, 2022
Conclusions
It has been established that the total energy of the harmonics of gravity range is invariably greater than the total energy of the harmonics of infragravity range. When the ratio of the total energy of the harmonics of gravity range to the total energy of the harmonics of infragravity range exceeds 5.5 in the spectra (2 s – 8 min), the maximum peak is almost always at the harmonic of gravity range. When this ratio is lower than 5.5, the maximum peak in the spectra (2 s – 8 min) is almost always at the harmonic of infragravity range.
Anomalous cases are observed when the statement given in the previous paragraph is not adhered to. A particularly pronounced anomaly is characterized by a substantial discrepancy. For instance, at values of this ratio of 2.9, 3.0 and 3.4, the maximum peak is observed to occur not on the harmonic of infragravity range, but rather on the harmonic of gravity range. Conversely, at values of this ratio of 8.4, 8.3 and 8.0, and other substantial numbers, the maximum peak is not on the harmonic of gravity range, but on the harmonic of infragravity range.
The occurrence of anomalous cases is observed in instances where the harmonics of infragravity or gravity ranges are defocused. In some cases, the defocusing of harmonics within the infragravity range is accompanied by the focusing of harmonics within the infragravity range. This is followed by the interaction of the harmonics within the infragravity range with those within the gravity range, resulting in the emergence of anomalous waves of large amplitudes, such as “two sisters” and “three sisters”.
1. Dolgikh, G., Budrin, S. and Dolgikh, S., 2020. Fluctuations of the Sea Level, Caused by Gravitational and Infra-Gravitational Sea Waves. Journal of Marine Science and Engineering, 8(10), 796. https://doi.org/10.3390/jmse8100796
2. Rabinovich, A.B., 1993. Long Gravitational Waves in the Ocean: Capture, Resonance, and Radiation. Saint Petersburg: Gidrometeoizdat, 325 p. (in Russian).
3. Longuet-Higgins, M.S., 1984. Statistical Properties of Wave Groups in a Random Sea State. Philosophical Transactions of the Royal Society A: Mathematical, Physical and Engineering Sciences, 312(1521), pp. 219-250. https://doi.org/10.1098/rsta.1984.0061
4. Thompson, W.C., Nelson, A.R. and Sedivy, D.G., 1985. Wave Group Anatomy of Ocean Wave Spectra. In: B. L. Edge, ed., 1985. Coastal Engineering 1984 Proceedings. Houston, Texas, United States: ASCE Press, pp. 661-677. https://doi.org/10.1061/9780872624382.046
5. Ekstrom, G. and Ekstrom, S., 2005. Correlation of Earth’s Long-Period Background Seismic Radiation with the Height of Ocean Waves. In: AGU, 2005. American Geophysical Union (AGU) 2005 Fall Meeting. San Francisco, CA, USA: AGU. Vol. 86(52), abstract S34B-02.
6. Romanowicz, B., Rhie, J. and Colas, B., 2005. Insights into the Origin of the Earth’s Hum and Microseisms. In: AGU, 2005. American Geophysical Union (AGU) 2005 Fall Meeting. San Francisco, CA, USA: AGU. Vol. 86(52), abstract S31A-0271.
7. Webb, S.C., 2007. The Earth’s “Hum” Is Driven by Ocean Waves over the Continental Shelves. Nature, 445, pp. 754-756. https://doi.org/10.1038/nature05536
8. Nishida, K., Kobayashi, N. and Fukao, Y., 2000. Resonant Oscillations between the Solid Earth and Atmosphere. Science, 287(5461), pp. 2244-2246. https://doi.org/10.1126/science.287.5461.2244
9. Kobayashi, N. and Nishida, K., 1998. Continuous Excitation of Planetary Free Oscillations by Atmospheric Disturbances. Nature, 395, pp. 357-360. https://doi.org/10.1038/26427
10. Nishida, K., Kobayashi, N. and Fukao, Y., 2002. Origin of Earth’s Ground Noise from 2 to mHz. Geophysical Research Letters, 29(10), pp. 52-1-52-4. https://doi.org/10.1029/2001GL013862
11. Dolgikh, G., Dolgikh, S., Chupin, V., Ovcharenko, V., Shvets, V. and Yakovenko, S., 2022. Registration of Nonlinear Hydrophysical Disturbances – Rogue Waves in Full-Scale Conditions. Journal of Marine Science and Engineering, 10(12), 1997. https://doi.org/10.3390/jmse10121997
12. Pelinovsky, E., Polukhina, O. and Kurkin, A., 2010. Rogue Edge Waves in the Ocean. The European Physical Journal Special Topics, 185, pp. 35-44. https://doi.org/10.1140/epjst/e2010-01236-9
13. Shurgalina, E.G. and Pelinovsky, E.N., 2012. Development of Freak Swell Wave in a Weak Wave Field. Fundamental and Applied Hydrophysics, 5(1), pp. 77-88 (in Russian).
14. Bowden, K.F., 1983. Physical Oceanography of Coastal Waters. Ellis Horwood Series in Marine Science. Chichester, New York: Halsted Press, Ellis Horwood Limited, 302 p.
15. Bjørnestad, M., Buckley, M., Kalisch, H., Streßer, M., Horstmann, J., Frøysa, H.G., Ige, O.E., Cysewski, M. and Carrasco-Alvarez, R., 2021. Lagrangian Measurements of Orbital Velocities in the Surf Zone. Geophysical Research Letters, 48(21), e2021GL095722. https://doi.org/10.1029/2021GL095722
16. Flores, R.P., Williams, M.E. and Horner-Devine, A.R., 2022. River Plume Modulation by Infragravity Wave Forcing. Geophysical Research Letters, 49(15), e2021GL097467. https://doi.org/10.1029/2021GL097467
17. Shuleikin, V.V., 1935. On Sea Voice. Doklady Akademii Nauk SSSR, 3(6), p. 259 (in Russian).
18. Dolgikh, G.I., Budrin, S.S., Dolgikh, S.G. and Plotnikov, A.A., 2020. Supersensitive Detector of Hydrosphere Pressure Variations. Sensors, 20(23), 6998. https://doi.org/10.3390/s20236998
19. Oh, J.-E., Jeong, W.-M., Chang, Y.S. and Oh, S.-H., 2020. On the Separation Period Discriminating Gravity and Infragravity Waves off Gyeongpo Beach, Korea. Journal of Marine Science and Engineering, 8(3), 167. https://doi.org/10.3390/jmse8030167
20. Dolgikh, G. and Dolgikh, S., 2023. Nonlinear Interaction of Infragravity and Wind Sea Waves. Journal of Marine Science and Engineering, 11(7), 1442. https://doi.org/10.3390/jmse11071442

