


Россия
Purpose. The purpose of the work is to estimate the long-term variations in concentration and flux of nutrients (inorganic nitrogen and inorganic phosphorus) in atmospheric deposition in Sevastopol. Methods and Results. During 2015–2023, the samples of atmospheric deposition in Sevastopol were collected to analyze the concentration of dissolved forms of inorganic nitrogen (nitrate, nitrite and ammonium) and phosphorus. For each precipitation event, two types of samplers were used – the open and wet-only ones. Laboratory analysis of the collected samples was carried out in FSBSI FRC “Marine Hydrophysical Institute”. A total of 1264 samples of atmospheric deposition were analyzed. The maximum content of nutrients was determined in the samples with minimum precipitation amount, or after a long dry period. The concentrations of inorganic forms of nitrogen in the samples from the open sampler were 1.3 times higher than those from the wet-only one. The phosphorus content in the open sampler exceeded that in the wet-only one by 3 times. The increased concentrations of ammonium in atmospheric deposition were revealed in spring, while those of nitrates – in fall-winter. The phosphorus flux in the samples from the open sampler reached its maximum value in fall and exceeded the winter flux by 2.3 times. Conclusions. The long-term variation in inorganic nitrogen flux is of a quasi-periodic pattern: its maximum flux was observed in 2017, and the minimum one – in 2019–2020. The maximum phosphorus flux in the samples from the wet-only sampler was noted in 2017–2018, whereas the phosphorus flux in the samples from the open sampler in 2021–2022 exceeded the flux in 2017–2018 by 1.5 times. As for inorganic nitrogen, its annual contribution to atmospheric deposition amounted 9.4–11.5% of a river runoff, and as for phosphorus – 16.7–55.6%. During the low-water period, these values were 12–14% and 20–65%, respectively.
atmospheric deposition, nutrients, inorganic nitrogen, nitrates, ammonium, phosphorus
 Introduction
Atmospheric precipitation serves as a primary source of various chemical components for many ecosystems. Yet, the composition of precipitation is found to be significantly affected by anthropogenic activity. Rainwater composition plays an important role in the absorption of soluble components from the atmosphere, thereby contributing to our understanding of the relative contribution of different sources of atmospheric pollutants [1]. Urban areas are more susceptible to problems associated with atmospheric deposition of coarse and fine particles, largely due to the high density of vehicles and the presence of large industrial enterprises [2]. According to [1], the increase in atmospheric emissions of pollutants, including sulfur dioxide, nitrogen oxides, volatile organic compounds and aerosols, is predominantly associated with the growth of urban population and the subsequent increase in traffic.
A variety of factors contribute to the presence of air pollutants in urban environments. Among these are industrial activity, dust from roads and construction sites, combustion of fossil fuels, etc. Studies have shown a link between urbanization and increased rates of atmospheric deposition of both inorganic nitrogen [3] and inorganic phosphorus [4]. The findings of [4] revealed that phosphate deposition in Rio Grande exhibited higher levels in comparison to adjacent rural regions. The observed differences were attributed to the anthropogenic influence of a large fertilizer manufacturing facility located in the city.
Human activities, particularly the combustion of fossil fuels and the synthesis and utilization of nitrogen fertilizers, have led to an increase in atmospheric emissions of sulfur oxide (SOx), nitrogen oxides (NOx), and ammonia (NH3). Consequently, this has led to increased levels of atmospheric deposition of sulfur and nitrogen in terrestrial and aquatic ecosystems [5–7]. In terrestrial ecosystems, excess atmospheric deposition of sulfur and nitrogen can lead to soil acidification, depletion of essential cations, changes in soil nutrients availability, nutrients imbalances in vegetation, loss of biodiversity, acidification, and eutrophication of nearby aquatic ecosystems [8, 9].
The primary sources of nitrogen in the air and atmospheric deposition include emissions from livestock farming, resulting from the application of manure and mineral fertilizers on agricultural fields, as well as catalysts in vehicles (ammonium), nitrogen oxides emissions from various combustion processes, the chemical industry, shipping, and other activities (nitrate) [10]. Owing to the surge in anthropogenic activities, such as deforestation, combustion of fossil fuels, and industrialization, there has been a marked increase in global nitrogen emissions since the pre-industrial era [11].
It has been established that the phosphorus content in the atmosphere is generally proportional to the total air dustiness and subject to significant fluctuations [12]. The primary natural sources of phosphorus in the atmosphere are wind erosion of the soil cover and the generation of biogenic aerosols by vegetation (spores, pollen and plant residues). Additionally, the presence of phosphorus in the atmosphere is known to occur during volcanic eruptions, the destruction of air bubbles on the surface of water bodies, and during vegetation combustion. Anthropogenic sources of phosphorus include the production of phosphorus fertilizers and agricultural work associated with the introduction of these fertilizers into the soil, metallurgical production, combustion of fossil fuels, fire retardants, industrial waste, construction dust, and road debris [8, 12–14]. Furthermore, cities tend to have a greater number of these sources in comparison to rural areas [15, 16]. The authors of [17] observed higher levels of inorganic phosphorus deposition in the Indian city Rajghat compared to rural areas, which was attributed to urban land use and biomass burning. In other studies [18], scientists attributed the increased phosphorus input to the urban atmosphere to the use of phosphate-containing fertilizers, weathering from mined rocks, and the burning of fossil fuels and plant biomass.
Significant quantities of particulate matter, including inorganic nitrogen and phosphorus, are introduced into the atmosphere due to industrial and transportation activities, as well as forest fires. Of particular concern in central and northern Brazil are forest fires, which are the primary sources of anthropogenic emissions of gases and aerosols during the dry season [19]. These fires have detrimental effects on ecosystems and air quality.
The study of the chemical composition of atmospheric precipitation is an important approach to assessing air pollution levels. This is due to the effective purification process of precipitation, which results in the removal of pollutants from the atmosphere and their transfer to other ecosystems, such as soil, water bodies (lakes, rivers, groundwater), forests, etc.
The present paper aims to study the long-term variations in concentration and flux of nutrients (inorganic nitrogen and inorganic phosphorus) with atmospheric precipitation in Sevastopol and estimate their impact on the Sevastopol Bay waters.
Methods
Atmospheric precipitation sampling area
The atmospheric precipitation sampling site is located in Sevastopol (Fig. 1) on the shore of Sevastopol Bay.
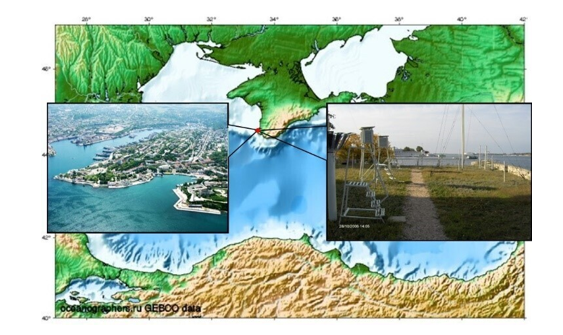
F i g. 1. Location of the atmospheric precipitation sampling site (Available at: https://arch-sochi.ru/2021/04/konczepcziya-razvitiya-infrastruktury-yahtinga-i-pribrezhnogo-morskogo-passazhirskogo-soobshheniya-na-azovo-chernomorskom-poberezhe-krasnodarskogo-kraya-2/)
The city of Sevastopol is located on the Black Sea coast in the southwestern part of the Crimean Peninsula. According to the Main Directorate of Natural Resources and Ecology of the city of Sevastopol (Sevprirodnadzor), the climate in Sevastopol is classified as relatively mild, with characteristics of a marine climate that is moderately continental in the foothills and subtropical Mediterranean in nature along the southeastern coast. The precipitation in Sevastopol exhibits variability, with annual rainfall from 300 to 500 mm/year. The amount of precipitation in the cold period is greater than in the warm period. The driest month is July.
Atmospheric precipitation sampling
The samples were collected in two types of samplers: wet-only and closed. To collect samples of wet precipitation without the influence of dry precipitation on the concentration of nutrients, an automatic sampler with a precipitation sensor was utilized. This device was developed and manufactured at the V.E. Zuev Institute of Atmospheric Optics of Siberian Branch of RAS (Tomsk), and it meets the requirements of the World Meteorological Organization (WMO). A Tretyakov precipitation gauge was utilized as an open sampler to assess the contribution of dry precipitation.
Individual samples of atmospheric precipitation were collected for each precipitation event. According to the requirements of the guidance document , samples were collected under the following conditions: if precipitation fell with a short interval (no more than 1 hour) and under consistent cloud cover, the samples were collected into a single container. If the interval exceeded 1 hour, the precipitation was collected as individual samples. The collected samples were transferred from the precipitation samplers into polyethylene containers and frozen for subsequent analysis. Each container was accompanied by the necessary information (indicated on the label), including the sampler type, the date of precipitation, air temperature, wind speed and direction, atmospheric pressure, relative air humidity at the time of the precipitation onset, and the precipitation amount.
Chemical analysis methods
Laboratory analysis of the samples was carried out at FSBSI FRC “Marine Hydrophysical Institute of RAS”. The content of inorganic forms of nitrogen (nitrate, nitrite and ammonium) and inorganic phosphorus was determined in the samples, which had a sufficient volume for chemical analysis.
The concentration of ammonium ions was determined using a modified Sagi-Solorzano method based on the phenol-hypochlorite reaction with the formation of indophenol [20]. The concentration range, as defined by the method, was 0.1–15.0 μM, with an error margin of ±12%. The content of nitrites and the sum of nitrites and nitrates were determined according to the method (RD 52.10.745-2020) by the spectrophotometric method on a Scalar San++ continuous flow automatic analyzer of nutrients (Netherlands). The minimum detectable concentration, as determined by the method, is 0.07 μM, with an error margin of ±20%. The phosphorus content was determined photometrically according to the method based on the formation of a blue phospho-molybdic complex. The minimum detectable concentration of phosphates is 0.05 μM, with an error margin of ±10%.
The concentration of nutrients in precipitation samples was processed using mathematical statistics methods based on the RD 52.04.186-89 requirements. In the selected atmospheric precipitation, nitrites were found in much lower concentrations than nitrates and ammonium. Their contribution to the total inorganic nitrogen input was approximately 2%. Consequently, in the present study, the total concentration of nitrates and ammonium is regarded as inorganic nitrogen.
Calculation of the nutrient input
In this study, the volume weighted mean concentration (Cvwm) value, as calculated using the specified formula, is employed as an average characteristic of the input of inorganic nitrogen and phosphorus:
Cvwm = ∑Ci∙Ri / ∑Ri,
where Cvwm is the volume weighted mean concentration, μM; Ci is the measured concentration in one sample, μM; Ri is the measured amount of precipitation for each individual rain event, mm.
The flux of dissolved nutrients was calculated as the product of the volume weighted mean concentration for a specified period and the precipitation amount. The calculation method is outlined in the following equation:
F = Cvwm∙R,
where F is the flux of the element under consideration with precipitation over a specified period (month, season, year), mM∙m−2∙season−1, mM∙m−2∙year−1; R is the total precipitation amount for the specified calculation period, mm.
Results and discussion
Number of the samples selected
Samples from Sevastopol were obtained from a 24-hour weather station, thus yielding a data set comprising 1,264 samples. The histogram illustrating the distribution of the analyzed samples’ amount by year is presented in Fig. 2.
Precipitation amount
Figure 3 shows the distribution of total precipitation by year and season, obtained on the basis of the samples collected.
The average annual precipitation in Sevastopol was 350.5 mm. The year 2020 was the driest. A seasonal pattern is evident in the precipitation data, with a decline observed in the spring-summer period, and an increase observed in the winter-fall period. The least amount of precipitation was observed in August, with a total of 100.6 mm recorded from 2015 to 2023. The maximum total precipitation for the period 2015–2023 was recorded in July and November, with values of 362.2 and 358.9 mm, respectively.

F i g. 2. Amount of atmospheric deposition samples collected in the open and wet-only samplers in Sevastopol
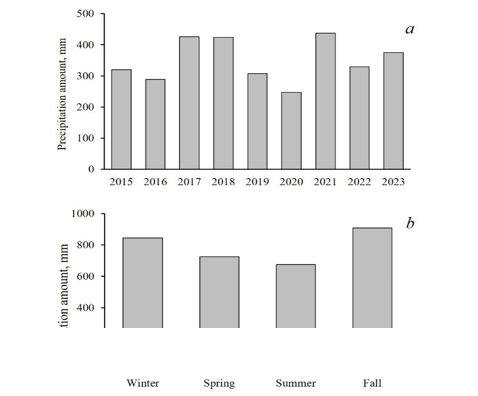
F i g. 3. Cumulative interannual (a) and seasonal (b) distribution of precipitation amount in Sevastopol during the study period
Concentration of nutrients
Our results show that atmospheric deposition plays an important role in the input of inorganic nitrogen and phosphorus to the underlying surface. Table 1 presents generalized data on the volume weighted mean concentrations of the considered nutrients for different types of samplers.
T a b l e 1
Concentrations of dissolved nutrients Cvwm, µM, in atmospheric deposition
in Sevastopol
|
Indicator |
Wet-only Sampler |
Open Sampler |
|
Nitrates |
40.51 |
53.65 |
|
Ammonium |
34.38 |
36.03 |
|
Phosphorus |
0.38 |
1.21 |
The maximum concentrations of the considered nutrients were determined in samples with minimal precipitation or following an extended dry period. In drier months, the atmosphere contains increased levels of dust, originating from the dry underlying surface and through dust transfer processes. Consequently, the combination of minimal precipitation, which dilutes pollutants, and increased dust levels could result in increased nutrient concentrations in these samples.
The volume weighted mean concentration of nitrates in atmospheric precipitation exceeded the ammonium concentration, with an excess of 18% for samples collected using a wet-only sampler and 49% for those collected using an open sampler.
In general, the concentrations of nutrients in the samples from the open sampler were higher than those from the wet-only one. However, for inorganic forms of nitrogen, this excess was insignificant – 1.3 times for nitrates and 1.05 times for ammonium. The concentration of phosphorus in the open sampler showed a threefold increase over the wet-only sampler. This discrepancy can be attributed to various origins and sources of these elements. Nitrogen is a soluble gas, while phosphorus is derived from terrigenous particles. This is significant because the gaseous form of phosphorus compounds plays a minimal role in the biogeochemical cycle of phosphorus. Therefore, the effect of dry aerosols on the total phosphorus supply is greater than that of inorganic nitrogen.
Flux of nutrients
For the designated sampling area, seasonal and annual values of fluxes of dissolved nutrients with atmospheric deposition were calculated.
Seasonal variation of nutrients input
A specific seasonal pattern is observed in the intra-annual fluctuation of nitrate input with atmospheric precipitation from both open and wet-only samplers. The flux increases in the fall-winter period and decreases in the spring-summer one. At the same time, the influx of ammonium reaches its peak during the spring season (Table 2).
T a b l e 2
Seasonal flux of dissolved nutrients, mM∙m−2∙season−1
in atmospheric deposition in Sevastopol
|
Season
|
Nitrates |
Ammonium |
Phosphorus |
|||
|
Wet-only sampler |
Open sampler |
Wet-only sampler |
Open sampler |
Wet-only sampler |
Open sampler |
|
|
Winter |
37.56 |
44.98 |
26.82 |
29.33 |
0.30 |
0.56 |
|
Spring |
28.25 |
36.59 |
31.42 |
32.27 |
0.33 |
1.08 |
|
Summer |
23.64 |
31.39 |
21.43 |
20.86 |
0.27 |
0.91 |
|
Fall |
30.67 |
44.51 |
22.05 |
23.54 |
0.28 |
1.32 |
The increase in the ammonium concentration during the warm period is likely due to the vital activity of animals and plants, as evidenced by the breakdown of urea and denitrification reactions [21]. The observed phenomenon is also likely associated with the seasonal intensification of recreational loads.
The input of phosphorus with atmospheric deposition in Sevastopol was an order of magnitude lower than the input of inorganic nitrogen. However, as with ammonium, the inorganic phosphorus flux increased from winter to spring. This may be attributed to a combination of factors that have a maximum effect in late spring, including pollen deposits, microbial activity, insect sedimentation, and the utilization of fertilizers that can enter the atmosphere as aerosols and subsequently settle [22, 23]. Furthermore, the input of phosphorus, as measured by samples from an open sampler, reached its maximum in fall and exceeded the input observed in winter by a factor of 2.3.
Interannual variation in the nutrients input
The annual flux of nutrients varied during the study period depending on precipitation amount and the average annual concentration. The average annual value of the nitrate flux for the wet-only sampler was 13.2 mM∙m−2 per year, whereas for the open sampler, it was 17.5 mM∙m−2 per year. For ammonium, the average annual flux values were 11.2 and 11.8 mM∙m−2 per year for the wet-only and open samplers, respectively.
Figure 4 shows the interannual variation in the input of nitrate and ammonium, as well as phosphorus resulting from atmospheric deposition.
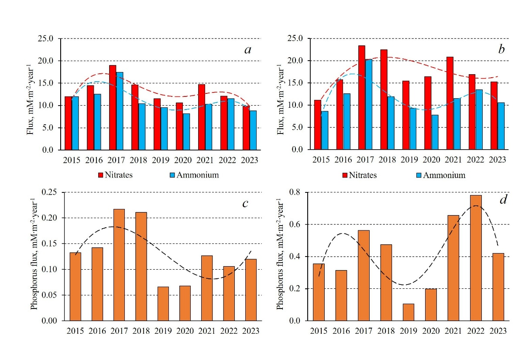
F i g. 4. Interannual variation of inorganic nitrogen flux in Sevastopol based on the wet-only (a) and open (b) samplers, and that of phosphorus based on the wet-only (c) and open (d) samplers. The dotted lines show trend lines
For samples collected using a wet-only sampler, a quasi-periodic variation in the flux of inorganic forms of nitrogen (both nitrate and ammonium) is observed, with a maximum input occurring in 2017 (Fig. 4, a). The nitrate input showed a lack of clear trend in the data collected using a permanently open sampler (Fig. 4, b). However, ammonium input demonstrated a consistent quasi-periodic variation. Concurrently, the difference between the maximum and minimum annual input of inorganic forms of nitrogen reached almost twofold.
The average annual values of the inorganic phosphorus flux for wet-only and open samplers were 0.13 and 0.43 mM∙m−2 per year, respectively. The interannual change in the phosphorus flux with atmospheric deposition (Fig. 4, c, d) also generally shows some quasi-periodicity with minimum values in 2019–2020. For samples from the wet-only sampler, the maximum phosphorus flux was observed in 2017–2018, but for samples from the open sampler, the flux in 2021–2022 exceeded the flux in 2017–2018 by almost 1.5 times. At the same time, the minimum and maximum element fluxes for the wet-only sampler differ by about three times, and for the open sampler by seven times, although the amount of precipitation during these periods (Fig. 3, a) did not differ so significantly. This difference may be due to the influence of long-range dust transport contributing to an increased phosphorus content in the air.
In addition to urbanization, climatic conditions influence atmospheric phosphorus concentrations. For instance, [24] showed a positive relationship between air temperature and total atmospheric phosphorus concentrations in Hamilton, Canada. However, no significant relationship was identified between average annual precipitation and phosphorus concentrations. Furthermore, the authors of [25] found that the difference between the rates of atmospheric phosphorus deposition in urban and rural areas was positively associated with average annual temperature.
In our work the dependence of interannual variation in phosphorus and inorganic nitrogen flux on mean annual air temperature was also analyzed. The findings revealed a statistically insignificant relationship between the fluxes of nutrients and atmospheric precipitation, as well as air temperature. Yet, a statistically significant positive correlation was observed between the flux of nutrients and the amount of precipitation, while a significant negative correlation was identified between the concentration of elements and the precipitation amount. These findings confirm the previously obtained results [26].
Nitrate/ammonium ratio
Despite the generally negligible excess of nitrate content over ammonium in atmospheric precipitation, seasonal variations in their concentrations are clearly visible (Fig. 5).
An increased ratio of nitrate to ammonium in atmospheric precipitation is observed during the cold season, which may be attributable to additional emissions of nitrogen oxides into the air coinciding with the beginning of the heating season [27]. In spring-summer period, the NO3−/NH4+ ratio in precipitation is observed to be less than one or slightly exceeds one in samples collected from a wet-only sampler. This can be explained by a slight decrease in the concentration of nitrate and an increase in the input of ammonium. Starting in fall, this ratio reaches 1.4 and remains at this level in winter. For samples obtained from an open sampler, a similar trend is observed, although the ratio value in fall reaches 1.9.

F i g. 5. Seasonal variation of the ratio of mineral forms of nitrogen in Sevastopol based on the samples from the wet-only (a) and open (b) samplers. Red line shows the ratio value equal to 1. The dotted lines show trend lines
Input of nutrients with atmospheric precipitation to the Sevastopol Bay waters
According to [28, 29], atmospheric precipitation is an important component of the cycle and redistribution of various chemical substances across water bodies, thereby playing a fundamental role in coastal biogeochemical processes. The input of nutrients from the atmosphere constitutes a significant source of income for the balance of seas and oceans. Moreover, the input from this source often exceeds the removal through river runoff [30]. In turn, the hydrochemistry of precipitation is largely determined by atmospheric emissions, thereby showing a direct correlation with both natural and anthropogenic activities [31]. Consequently, quantitative and qualitative assessments of precipitation and associated impurities are crucial for a better understanding of the anthropogenic impact on these biogeochemical processes. This is of practical importance as well, given that polluted atmospheric precipitation can have a negative impact on local fauna and flora, human health, etc. [31].
The majority of cities are located in coastal areas and along river banks [32], making coastal aquatic ecosystems vulnerable to runoff of various substances. As urban development expands, it becomes imperative to understand how urbanization influences the atmospheric input of nutrients. Therefore, we have determined the impact of inorganic nitrogen and phosphorus inputs from atmospheric precipitation on Sevastopol Bay.
The amount of inorganic nitrogen and phosphorus entering Sevastopol Bay with precipitation can be estimated based on the bay’s area (7.96 km2) and the calculated fluxes of these elements.
The average annual flux of inorganic nitrogen resulting from atmospheric deposition is 24.4 mM∙m−2 per year for a wet-only sampler and 29.7 mM∙m−2 per year for an open sampler. The average phosphorus flux values are 0.13 and 0.43 mM∙m−2 per year for wet-only and open samplers, respectively. Consequently, the inorganic nitrogen input to the bay water area, calculated according to the data obtained, will be 2.6–3.2 t∙year−1, and the phosphorus will be 0.03–0.1 t∙year−1.
According to the data presented in [33], the average long-term removal of nutrients into Sevastopol Bay from the Chernaya River is 27.8 t∙year−1for inorganic nitrogen and 0.18 t∙year−1for inorganic phosphorus. Consequently, the contribution of atmospheric precipitation constitutes 9.4–11.5% of the river runoff for nitrogen and 16.7–55.6% for phosphorus. However, the removal of nutrients with river runoff during the low-water period is significantly less – 10.16 t∙year−1 of inorganic nitrogen and 0.08 t∙year−1 of inorganic phosphorus. Consequently, the influence of atmospheric precipitation as a source of nutrients will be more significant. According to our calculations, atmospheric precipitation contributes 12–14% of the inorganic nitrogen and 20–65% of the phosphorus, when compared to river runoff during the low-water period.
It has been increasingly recognized that atmospheric phosphorus input constitutes a significant source of phosphorus for terrestrial, freshwater, and marine ecosystems [8]. The results obtained in the present paper confirm these observations. Despite the reduced content of phosphorus in atmospheric deposition compared to inorganic nitrogen, their contribution to the inorganic phosphorus budget in Sevastopol Bay exceeds that of nitrogen. At the same time, phosphorus is an essential element for all organisms and can limit primary productivity. However, in excess, phosphorus can leak from terrestrial to freshwater and marine ecosystems, leading to eutrophication and a decrease in the dissolved oxygen content [9].
Conclusion
The present paper examines the long-term variation in the concentration and flux of nutrients (inorganic nitrogen and inorganic phosphorus) with atmospheric deposition in Sevastopol for 2015–2023.
It is shown that atmospheric deposition is an important source of inorganic nitrogen and phosphorus in the underlying surface. The maximum concentrations of the considered nutrients were determined in samples with minimal precipitation or following an extended dry period.
In general, the concentrations of nutrients in samples from the open sampler were higher than those from the wet-only one. However, this excess was found to be insignificant for inorganic forms of nitrogen. Conversely, the concentration of phosphorus in the open sampler was found to be three times higher than its concentration in the closed sampler.
A specific seasonal pattern is observed in the intra-annual variation in nitrate input with atmospheric precipitation. During the fall-winter period, the flux increases, while in the spring-summer period, it decreases. The input of ammonium is maximum in spring. The input of phosphorus with atmospheric precipitation in Sevastopol was less than the input of inorganic nitrogen. However, the flux of inorganic phosphorus showed a similar trend to that of ammonium, increasing from winter to spring.
The annual flux of nutrients varied during the study period depending on the precipitation amount and the average annual concentration. The average annual flux of nitrate for the wet-only sampler was 13.2 mmol∙m−2 per year, whereas for the open sampler, it was 17.5 mmol∙m−2 per year. For ammonium, the average annual flux values were 11.2 and 11.8 mmol∙m−2 per year for the wet-only and open samplers, respectively. The average annual flux of inorganic phosphorus for the wet-only and open samplers was 0.13 and 0.43 mmol∙m−2 per year, respectively.
The impact of inorganic nitrogen and phosphorus input with atmospheric precipitation on Sevastopol Bay was determined. The contribution of atmospheric precipitation to river runoff was determined to be 9.4–11.5% for nitrogen and 16.7–55.6% for phosphorus. However, during the low-water period, the removal of nutrients through river runoff is significantly less. Consequently, atmospheric precipitation is a more substantial source of nutrients, contributing 12–14% of inorganic nitrogen and 20–65% of phosphorus.
1. Migliavacca, D.M., Teixeira, E.C., Wiegand, F., Machado, A.C.M. and Sanchez, J., 2005. Atmospheric Precipitation and Chemical Composition of an Urban Site, Guaíba Hydrographic Basin, Brazil. Atmospheric Environment, 39(10), pp. 1829-1844. https://doi.org/10.1016/j.atmosenv.2004.12.005
2. Fornaro, A. and Gutz, I.G.R., 2006. Wet Deposition and Related Atmospheric Chemistry in the São Paulo Metropolis, Brazil. Part 3: Trends in Precipitation Chemistry during 1983–2003. Atmospheric Environment, 40(30), pp. 5893-5901. https://doi.org/10.1016/j.atmosenv.2005.12.007
3. Decina, S.M., Hutyra, L.R. and Templer, P.H., 2020. Hotspots of Nitrogen Deposition in the World's Urban Areas: A Global Data Synthesis. Frontiers in Ecology and the Environment, 18(2), pp. 92-100. https://doi.org/10.1002/fee.2143
4. Casartelli, M.R., Mirlean, N., Peralba, M.C., Barrionuevo, S., Gómez-Rey, M.X. and Madeira, M., 2008. An Assessment of the Chemical Composition of Precipitation and Throughfall in Rural-Industrial Gradient in Wet Subtropics (Southern Brazil). Environmental Monitoring and Assessment, 144(1-3), pp. 105-116. https://doi.org/10.1007/s10661-007-9949-y
5. Fowler, D., Coyle, M., Skiba, U., Sutton, M.A., Cape, J.N., Reis, S., Sheppard, L.J., Jenkins, A., Grizzetti, B. [et al], 2013. The Global Nitrogen Cycle in the Twenty-First Century. Philosophical Transactions of the Royal Society B, 368(1621), 20130164. http://doi.org/10.1098/rstb.2013.0164
6. Lohse, K.A., Hope, D., Sponseller, R., Allen, J.O. and Grimm, N.B., 2008. Atmospheric Deposition of Carbon and Nutrients across an Arid Metropolitan Area. Science of the Total Environment, 402(1), pp. 95-105. https://doi.org/10.1016/j.scitotenv.2008.04.044
7. Yang, Y., Zhao, T., Jiao, H., Wu, L., Xiao, C., Guo, X. and Jin, C., 2022. Atmospheric Organic Nitrogen Deposition in Strategic Water Sources of China after COVID-19 Lockdown. International Journal of Environmental Research and Public Health, 19(5), 2734. https://doi.org/10.3390/ijerph19052734
8. Decina, S.M., Templer, P.H. and Hutyra, L.R., 2018. Atmospheric Inputs of Nitrogen, Carbon, and Phosphorus across an Urban Area: Unaccounted Fluxes and Canopy Influences. Earth's Future, 6(2), pp. 134-148. https://doi.org/10.1002/2017EF000653
9. Sumathi, M. and Vasudevan, N., 2019. Role of Phosphate in Eutrophication of Water Bodies and Its Remediation. Journal of Chennai Academy of Sciences, 1, pp. 65-86.
10. Van der Swaluw, E., Asman, W.A.H., Van Jaarsveld, H. and Hoogerbrugge, R., 2011. Wet Deposition of Ammonium, Nitrate and Sulfate in the Netherlands over the Period 1992–2008. Atmospheric Environment, 45(23), pp. 3819-3826. https://doi.org/10.1016/j.atmosenv.2011.04.017
11. Singh, A., Gandhi, N. and Ramesh, R., 2012. Contribution of Atmospheric Nitrogen Deposition to New Production in the Nitrogen Limited Photic Zone of the Northern Indian Ocean. Journal of Geophysical Research: Oceans, 117(C6), C06004. https://doi.org/10.1029/2011JC007737
12. Savenko, V.S. and Savenko, A.V., 2007. Geochemistry of Phosphorus in the Global Hydrological Cycle. Moscow: GEOS, 248 p. (in Russian).
13. Mahowald, N., Jickells, T.D., Baker, A.R., Artaxo, P., Benitez-Nelson, C.R., Bergametti, G., Bond, T.C., Chen, Y., Cohen, D.D. [et al.], 2008. Global Distribution of Atmospheric Phosphorus Sources, Concentrations and Deposition Rates, and Anthropogenic Impacts. Global Biogeochemical Cycles, 22(4), GB4026. https://doi.org/10.1029/2008GB003240
14. Violaki, K., Nenes, A., Tsagkaraki, M., Paglione, M., Jacquet, S., Sempéré, R. and Panagiotopoulos, C., 2021. Bioaerosols and Dust Are the Dominant Sources of Organic P in Atmospheric Particles. npj Climate and Atmospheric Science, 4, 63. https://doi.org/10.1038/s41612-021-00215-5
15. Dadashpoor, H., Azizi, P. and Moghadasi, M., 2019. Land Use Change, Urbanization, and Change in Landscape Pattern in a Metropolitan Area. Science of the Total Environment, 655, pp. 707-719. https://doi.org/10.1016/j.scitotenv.2018.11.267
16. Liu, Y., Luo, T., Liu, Z., Kong, X., Li, J. and Tan, R., 2015. A Comparative Analysis of Urban and Rural Construction Land Use Change and Driving Forces: Implications for Urban–Rural Coordination Development in Wuhan, Central China. Habitat International, 47, pp. 113-125. https://doi.org/10.1016/j.habitatint.2015.01.012
17. Yadav, A. and Pandey, J., 2017. Contribution of Point Sources and Non-Point Sources to Nutrient and Carbon Loads and Their Influence on the Trophic Status of the Ganga River at Varanasi, India. Environmental Monitoring and Assessment, 189(9), 475. https://doi.org/10.1007/s10661-017-6188-8
18. Vitousek, P.M., Porder, S., Houlton, B.Z. and Chadwick, O.A., 2010. Terrestrial Phosphorus Limitation: Mechanisms, Implications, and Nitrogen-Phosphorus Interactions. Ecological Applications, 20(1), pp. 5-15. https://doi.org/10.1890/08-0127.1
19. Liousse, C., Andreae, M.O., Artaxo, P., Barbosa, P., Cachier, H., Gregoire, J.M., Hobbs, P., Lavoue, D., Mouillot, F. [et al.], 2004. Deriving Global Quantitative Estimates for Spatial and Temporal Distributions of Biomass Burning Emissions. In: C. Granier, P. Artaxo and C. E. Reeves, eds., 2004. Emissions of Atmospheric Trace Compounds. Advances in Global Change Research. Dordrecht, Netherlands: Springer. Vol. 18, pp. 71-113. https://doi.org/10.1007/978-1-4020-2167-1_3
20. Solórzano, L., 1969. Determination of Ammonia in Natural Waters by the Phenolhypochlorite Method. Limnology and Oceanography, 14(5), pp. 799-801. https://doi.org/10.4319/lo.1969.14.5.0799
21. Chebunina, N.S., Onischuk, N.A., Netsvetaeva, O.G. and Hodger, T.V., 2018. Dynamics of the Content of Mineral Forms of Nitrogen in Watercourses and Atmospheric Precipitation Listvyanka Settlement (South Baikal). The Bulletin of Irkutsk State University. Series Earth Sciences, 24, pp. 124-139. https://doi.org/10.26516/2073-3402.2018.24.124 (in Russian).
22. Bettez, N.D. and Groffman, P.M., 2013. Nitrogen Deposition in and near an Urban Ecosystem. Environmental Science and Technology, 47(11), pp. 6047-6051. https://doi.org/10.1021/es400664b
23. Kopáček, J., Kaňa, J., Porcal, P., Vrba, J. and Norton, S.A., 2019. Effects of Tree Dieback on Lake Water Acidity in the Unmanaged Catchment of Plešné Lake, Czech Republic. Limnology and Oceanography, 64(4), pp. 1614-1626. https://doi.org/10.1002/lno.11139
24. Furdui, V.I., Duric, M., Eskander, H.G. and Stacey, N., 2022. Temporal Trends of Phosphorus in Urban Atmospheric Aerosols. Canadian Journal of Chemistry, 100(7), pp. 538-544. https://doi.org/10.1139/cjc-2021-0220
25. Blake, K. and Templer, P.H., 2023. Interacting Effects of Urbanization and Climate on Atmospheric Deposition of Phosphorus around the Globe: A Meta-Analysis. Atmospheric Environment, 309, 119940. https://doi.org/10.1016/j.atmosenv.2023.119940
26. Varenik, A.V., 2019. Applying the Brandon Method to Estimate the Concentration of Inorganic Nitrogen in Precipitation. Russian Meteorology and Hydrology, 44(5), pp. 326-330. https://doi.org/10.3103/S1068373919050030
27. Varenik, A.V., 2020. Influence of Emissions from the Stationary Heat Sources upon the Atmospheric Precipitation Pollution with Inorganic Nitrogen in the Sevastopol Region. Physical Oceanography, 27(3), pp. 257-265. https://doi.org/10.22449/1573-160X-2020-3-257-265
28. Wright, L.P., Zhang, L., Cheng, I., Aherne, J. and Wentworth, G.R., 2018. Impacts and Effects Indicators of Atmospheric Deposition of Major Pollutants to Various Ecosystems - A Review. Aerosol and Air Quality Research, 18(8), pp. 1953-1992. https://doi.org/10.4209/aaqr.2018.03.0107
29. Savenko, V.S., 1996. Atmospheric Component of the Geochemical Balance of Phosphorus in the Modern Ocean. Reports of the Academy of Sciences, 350(3), pp. 390-392 (in Russian).
30. Singh, K.P., Singh, V.K., Malik, A., Sharma, N., Murthy, R.C. and Kumar, R., 2007. Hydrochemistry of Wet Atmospheric Precipitation over an Urban Area in Northern Indo-Gangetic Plains. Environmental Monitoring and Assessment, 131, pp. 237-254. https://doi.org/10.1007/s10661-006-9472-6
31. Hao, Z., Gao, Y., Yang, T. and Tian, J., 2017. Atmospheric Wet Deposition of Nitrogen in a Subtropical Watershed in China: Characteristics of and Impacts on Surface Water Quality. Environmental Science and Pollution Research, 24(9), pp. 8489-8503. https://doi.org/10.1007/s11356-017-8532-5
32. Grimm, N.B., Faeth, S.H., Golubiewski, N.E., Redman, C.L., Wu, J., Bai, X. and Briggs, J.M., 2008. Global Change and the Ecology of Cities. Science, 319(5864), pp. 756-760. http://dx.doi.org/10.1126/science.1150195
33. Myslina, M.A., Varenik, A.V. and Tarasevich, D.V., 2024. Dynamics of Nutrients Concentration in the Chernaya River Waters (Crimean Peninsula) in 2015-2020. Physical Oceanography, 31(3), pp. 398-408.