


Россия
Purpose. The purpose of the study is to consider both the features of storms in the attenuation stage as a factor in the coastal profile restoration after storm erosion, and a potential cause of seasonal deformations. Methods and Results. Seasonal morphodynamics of accumulative coastal areas was studied in the regions both of the Vistula Spit (South-Eastern Baltic) based on the monitoring measurements of coastal profile performed by the employees of the Shirshov Institute of Oceanology, RAS, from May 2019 to March 2022 and the Oktyabrskaya Spit (western Kamchatka) using the measurement data taken in 2010–2011. Two indices describing the storm structure are used: the ratio of the attenuation stage duration to the total storm duration Rt, and the ratio of the median value of storm wave height during the attenuation stage to the peak wave height of the storm event RHs. The variations in R_t and R_Hs during a year are statistically analyzed based on the ERA5 long-term wave reanalysis data. It is found that the R_t index does not tend to change on a seasonal scale. When the R_Hs index is close to one and changes slightly during a year, the coastal profile does not experience seasonal changes. If R_Hs changes in course of a year decreasing significantly during the period of more intense waves, the coast experiences seasonal changes. Conclusions. The variations in wave intensity during a year do not always result in the change of average position of the coastal profile. The key factor may consist in the seasonal trends in wave parameter changes within a storm cycle. The proposed index R_Hs can be regarded as a criterion for the behavior type of sandy coasts on a seasonal scale.
sandy coast, coastal profile, wave regime, underwater bar, morphodynamics, seasonal deformations, stages of storm
Introduction and theoretical background of the study
According to existing concepts, seasonal deformations of the coastal accumulative profile are characterized by the removal of sand sediments to depth with the isolation of the underwater bar during the storm season and the accumulative terrace adjoining to the coast during the season of moderate waves (Fig. 1). It is believed that the observed sandy coast morphodynamics are indicative of a change in wave intensity between seasons or are associated with a series of storm events (see, for example, [1–4]). At the same time, there are coasts that exhibit resistance to wave energy fluctuations on a seasonal scale, yet are sensitive to individual storm events or undergo unidirectional changes over several years [5, 6]. The study of such properties of individual storms or their series that can determine the nature of coastal profile deformations on a seasonal scale is of undoubted interest to coastal science. The identification of these properties will allow for the forecasting of one or another character of morphodynamics of accumulative sandy coasts.
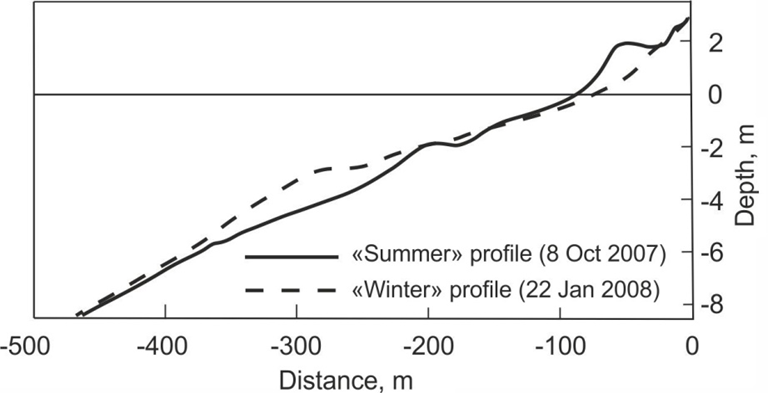
F i g. 1. Seasonal differences in the sand profile (San Diego, California, USA) (adapted from
[1, p. 41])
The initial documentation of seasonal deformation of the coastal sand profile was conducted by F. Shepard, who used the California coast as a case study. Subsequent studies along this coastline contributed to the formulation of the main theoretical principles related to deformations of this nature [1, 7]. The main principle asserts that the fluctuation in wave energy throughout the year causes a change in the accumulation and erosion modes of the coastal profile. The so-called “winter” profile (Fig. 1) is essentially an erosion profile, and the “summer” profile is an accumulation profile or a profile restored after erosion.
It should be noted that the wave conditions of the California coast, where the study of seasonal deformations of the sandy coast was conducted for the first time, are characterized by intense waves during the storm season and a relatively long period of influence by gentle Pacific swell waves during the moderate season. This phenomenon determines the corresponding differences in the coastal profile (see Fig. 1). In fetch-limited conditions, where short and steep wind waves predominate during the storm period and the swell effect is expressed insignificantly, the limiting states of the profile characteristic of different seasons may be less contrasting [8, 9].
As previously mentioned, seasonal deformations are associated with fluctuations in the intensity and steepness of waves throughout the year. The author of this study proposes a hypothesis that the possible cause of seasonal rhythms in the accumulative coast morphodynamics is the variable nature of storm events throughout the year.
A separate storm can be described by the maximum wave parameters and by the dynamics of changes in these parameters during the full storm cycle – from an intensive increase in wave heights at the initial stage to complete attenuation at the end stage. To describe these changes during the full storm cycle, the concept of “storm structure” was proposed. Storm structure is characterized by the duration and energy of the waves of the three main stages (phases) of the storm: development, stabilization, and attenuation. In the event of coastal erosion during the development and stabilization stage of a storm (the erosive phase), a partial or complete recovery of the affected area may occur during the attenuation stage (the recovery period).
Sediments removed to a certain depth during the process of wave erosion of the coastal profile at the storm development and stabilization stage can be displaced toward the coast at the attenuation stage due to wave transport. This phenomenon occurs as a consequence of wave velocity asymmetry during nonlinear transformation of waves [10, 11]. The greater the intensity of the storm maximum phase, the deeper the sediments are transported during erosion. In the event of significantly reduced heights of storm waves at the attenuation stage relative to previous maximums, the wave transport toward the coast also weakens, owing to the decreased depth of the wave effect on the bottom. Accordingly, if the energy of storm waves at the attenuation stage approaches the magnitude of storm waves in the peak phase, the wave transport intensifies contributing to an increased return of sediments toward the coast.
This pattern can also be explained by the erosion profile property, which states that a profile of this nature is formed due to the removal of sediment to depth during the intensification and stabilization of storms. The erosion profile and the accumulation profile, two limiting states of a sand profile, can be correlated with the dissipative and reflective states of the coastal profile. This correlation is possible within the framework of the concept of an accumulative coast evolution, which was proposed by Australian researchers L. Wright and A. Schott [12]. According to this concept, dissipative profiles are relatively resistant to erosion. However, in cases of higher wave energy exposure, the dissipative profile becomes susceptible to erosion, leading to a restoration phase characterized by the accumulation of sediments (see the area outlined by a rectangular contour in Fig. 2). In cases of lower wave energy, the accumulation intensity decreases. The intensity of waves in this approach is estimated using the Dean’s parameter [13]:

where  is the wave height at breaking;
  is the sediment fall velocity;
  is the peak period of waves.
In other words, if wave regime at the stabilization stage can be characterized by a certain value  (Fig. 2), and the wave regime during attenuation – by the value
  , then the intensity of accumulation at this stage will be determined by the value
  [14]:
[14]:

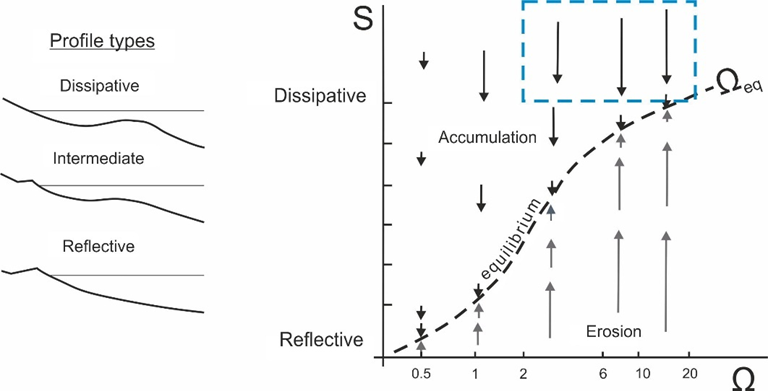
F i g. 2. Conceptual diagram illustrating the relationship between the type of coastal accumulative profile (indicative parameter S), the amount of wave energy (the Dean parameter  ) and the relative intensity of accumulation and erosion (proportional to the arrow lengths). Blue dashed contour highlights the conditions of intense accumulation at higher wave energy on the dissipative profile (adapted from [12, р. 114])
When the intensity of the waves at the attenuation stage decreases, < 0, and, according to [14], the greater the difference between the and values, the lower the intensity of the accumulative process.
Thus, the aforementioned arguments show that if the waves at the attenuation stage are closer in intensity to the storm waves in the peak phase, then this contributes to the restoration of the coastal profile after erosion.
The existing coastal science indicators that describe the storm event structure are based on characteristics such as wave energy and the duration of certain stages. Based on the results of long-term observations conducted at six locations along the Baltic and Black Sea coasts, a storm structure coefficient has been proposed:

where  ,
,  ,
,  are the total wave energy at the development, stabilization, and attenuation stages, respectively, expressed as a percentage of the total storm energy. It is shown that positive deformations are observed at
  , while negative deformations are observed at
  .
.
The ratio of the duration of the maximum storm phase to the attenuation stage determines the so-called storm coefficient [15]:
![]()
where  is the duration of the storm stabilization phase;
  is the duration of the storm attenuation stage. As the coefficient approaches zero, the role of the wave attenuation stage becomes more pronounced, thereby reducing the final erosion of the profile. This pattern is based on observations of the coastal profile dynamics in experimental wave setups and in natural conditions.
The ratio of the duration of the storm attenuation stage to the total storm event duration forms the basis of the concept of effective wave height  [16]. Based on this concept, an analytical model describing the deformations of the coastal profile over a full storm cycle is proposed:
 , (4)
, (4)
where  is the maximum height of storm wave,
  is its minimum height at the end of the storm (conventionally designated as 1 m), and and
  are duration of the attenuation stage and the total storm duration, respectively.
Thus, the theoretical justifications and examples from published sources demonstrate that the key parameters of storm structure are the duration of specific stages and the amount of wave energy associated with these stages. In the case of a prolonged or more “energetic” storm in the attenuation stage, a greater quantity of sediment will be transported towards the coast by the end of the storm event.
This paper aims to investigate the impact of these variations in storm behavior during the attenuation stage on the behavior of the sandy coast.
Initial data and methods
In order to achieve the set goal, two specific coastal regions were selected for study: the Vistula Spit area (South-Eastern Baltic) and the Oktyabrskaya Spit area (Oktyabrsky settlement, western Kamchatka, eastern part of the Sea of Okhotsk). These regions are associated with extended barrier forms of the coastal sand bar type.The differences between the selected regions are that the Western Kamchatka coast in the Oktyabrskaya Spit area is characterized by tides, with a maximum amplitude of 3 m [17]. A distinctive feature of this coast is the presence of ice on the beach from December to May, inclusive. In this regard, changes in relief, typical for a sandy coast and caused by waves, can only be observed from June to November. In contrast, the coasts of the South-Eastern Baltic are non-tidal, with ice in the coastal zone being extremely rare and limited to a period of no more than a few days.
The average slope of the coastal profile at the Vistula Spit, extending from the water’s edge to a depth of 7.5 m, is 0.014, and at the Oktyabrskaya Spit – 0.008 (Fig. 3). The coastal profile at the Vistula Spit is complicated by the presence of a well-defined underwater bar. The classification of coastal accumulative profiles by the type of prevailing dynamic environment based on the Dean parameter ( ), as outlined in [12], indicates that both banks are classified as dissipative:  = 5.13 for the Vistula Spit and
  = 6.41 for the Oktyabrskaya Spit. To calculate the values of , expression (1) and ERA5 wave reanalysis data for a long-term period were used, as discussed below.
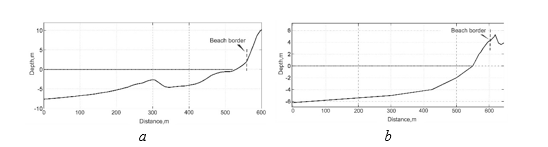
F i g. 3. Coastal profiles typical for the regions of the Vistula (a) and Oktyabrskaya (b) spits
For the selected regions, data concerning the dynamics of the coastal profile in various seasons were obtained. The coastal profile was measured along the Baltic Sea coast from May 2019 to March 2022 as a part of the monitoring work conducted by the Shirshov Institute of Oceanology of RAS on the Vistula Spit. On the Sea of Okhotsk coast, measurements were carried out in 2010–2011 as part of the work performed to develop recommendations for the Oktyabrskaya Spit protection from storm erosion [18]. On the coast of Oktyabrskaya Spit, repeated measurements were carried out only for the above-water part of the coastal profile.
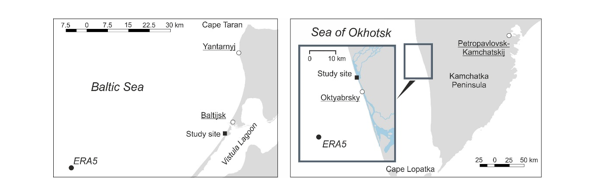
F i g. 4. Sites of coastal profile measurements: on the left – in the Baltic Sea; on the right – in the Sea of Okhotsk (coastline site marked with black rectangle is shown enlarged in the inset). Points of wave reanalysis data unloading are marked with the circles labeled “ERA5”
The wave conditions were calculated using the ERA5 wave reanalysis data [19] from the European Centre for Medium-Range Weather Forecasts (ECMWF) for the calculation points closest to the field observation areas: 54.5°N, 19°E for the South-Eastern Baltic and 52.5°N, 156°E for the Sea of Okhotsk (Fig. 4). The ERA5 point for the South-Eastern Baltic is located 10 km off the coast (the point depth applied in the calculations of the ERA5 reanalysis wave model is 54 m), and the point near the Western Kamchatka coast is 21 km off the shore (the corresponding depth is 209 m). The wave data studied were collected at 3-hour intervals. For the Baltic Sea, the ERA5 wave reanalysis data were verified based on measurements of wave parameters in the coastal zone using the Spoondrift Spotter buoy [20]. It was revealed that the reanalysis data have quite satisfactory convergence with the measured wave parameters.
The ERA5 reanalysis datasets contain significant wave heights  (m) that are characterized by extreme values. values for individual storm events were extracted from the wave data time series in the Matlab software environment. The selection of storm events was based on the criterion of wave height exceeding 1 m and a storm duration of at least 12 h. Storm events for which the development or attenuation stage is not determined, i.e., the maximum wave height is confined to the initial or final time point of the storm, were not taken into account. As a result, 1,355 storm events (1979–2020, 42 years) were considered for the South-Eastern Baltic, and 1,459 storm events (1992–2021, 30 years) for the Western Kamchatka.
To calculate the Dean’s parameter ( ), the wave height at breaking
  was calculated using the expression [21]:
![]()
where  is the wave height in deep water (here and below, we use significant wave height
  as the H value according to the ERA5 reanalysis data);
  is the wavelength in deep water, determined by the ratio
  (in this case, the average wave period
  is used as
  according to the ERA5 reanalysis data). The sediment fall velocity ( ) was calculated using the expression [22]:
where  is the diameter of sand deposits. For both coastal areas, an approximate value of the median diameter of sand deposits on the underwater coastal slope was determined to be 0.25 mm, according to the works [23, 24]. The peak period of waves ( ) was calculated using the expression [25]
According to the aforementioned theoretical background of the study, the key parameters of a storm in the attenuation stage are relative characteristics of its duration and wave intensity. For the quantitative assessment of each storm event in this stage, the following characteristics were determined:
- storm event duration (
 , h);
, h); - duration of the storm attenuation stage (
 , h);
, h); - maximum wave height of storm (
- median value of storm wave height in the attenuation stage (
The median value of the storm wave height in the attenuation stage ( ) is applied to estimate the wave energy due to the fact that the average value is highly sensitive to outliers. In this case, outliers are short-term peaks or minimums of the wave height, which will have little effect on the morphodynamics. This is due to the fact that the coastal profile reshaping is associated with a relatively long-term wave effect, as demonstrated during experimental studies [21, 26].
The author proposes two special indices of storm structure. The index  characterizes relative duration of storm attenuation stage:
The  index characterizes the relative value of storm wave energy in the attenuation stage:
The closer the values of and indices are to one, pointed that storm in the attenuation phase has a higher potential for recovering the coastal profile. Previously developed approaches to assessing storm structure (expressions (2)–(4)) [15, 16] were applied for developing these indices. Statistical analysis of these indices is possible due to the use of wave reanalysis data for a long-term period. In turn, field data on the seasonal morphodynamics of accumulative coastal areas allow us to verify the results.
Study results
At the outset of the study, an analysis of the seasonality in the storm activity distribution was performed. The following indices were determined for each month (Fig. 5, 6):
 is mean duration of storm events (h);
A study of two specific water areas revealed common features in the annual dynamics of storm activity. It was shown that maximum wave heights and their average values ( ,  ) exhibit well-defined seasonal variability, with a minimum in May – July, followed by an increase in wave intensity until November (Fig. 5).
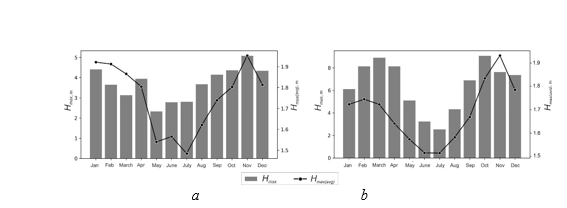
F i g. 5. Distribution of  and
and  values by months: a – for the South-Eastern Baltic; b – for the Western Kamchatka
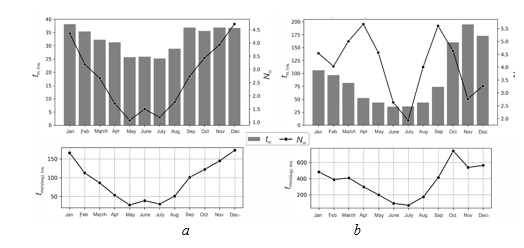
F i g. 6. Distribution of  ,
,  and
and  values by months: a – for the South-Eastern Baltic; b – for the Western Kamchatka
In the South-Eastern Baltic, similar seasonal variability is also characteristic of the indices that determine the occurrence of storms:  ,
,  ,
,  (Fig. 6). In Western Kamchatka, the maximum number of storms ( ) is observed in April and September. In spring, the Western Kamchatka is characterized by the presence of ice on the beach, and our focus is on the summer and autumn periods. Following the peak in September, the average number of storms decreases against the background of increasing in their duration. Nevertheless, relatively high
  and
and  values are observed in October, which, in conjunction with the elevated values of
  and
and  allows us to characterize this month as the peak of storm activity. For the South-Eastern Baltic, all the studied indices exhibit a similar trend, with a peak in storm activity from November to January.
For quantitative characterization of wave variability during the year, we can use the index  proposed in the work [5], where
  is the average value of the standard deviation of the Dean’s parameter Ω for the specified years (
 ) and months (
 ). The higher the value of the index , the more the studied coastal area is subject to seasonal fluctuations in wave steepness during the year. If
  index is close to one, the morphodynamics of a given coast are affected mostly by individual storms. The calculations performed indicate that the indices for the areas under study are approximately equal, with values of 1.06 for the Vistula Spit area and 1.006 for the water area of the Sea of Okhotsk. Thus, according to this index, the coast morphodynamics are mostly affected by individual storms, rather than by seasonal variation in wave intensity.
The  and
and  indices proposed in this study were calculated further. Their values were then compared with the seasonal variation of storm activity. Statistical processing of values for each storm (Fig. 7) revealed that no visible seasonal differences in the dynamics of this index were indicated during the year. The median value is close to 0.6 for each month for the two water areas under study.
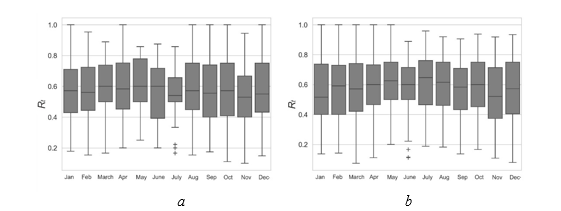
F i g. 7. Statistical characteristics of the change in index  during a year for the parts of water areas of the South-Eastern Baltic (a) and the Western Kamchatka (b) under study
A statistical analysis of the values (Fig. 8) showed that, for the waters of the South-Eastern Baltic, the differences in the median values across each month are not statistically significant. The maximum value recorded was 0.86 in July, while the minimum value was 0.79 from January to March. A well-defined seasonal dynamic is observed for the Western Kamchatka waters, characterized by the median values that approach one in June and July (~ 0.85) and decrease to a minimum by November (~ 0.54). In the Western Kamchatka, a correlation has been observed between the increase in wave intensity  ,
,  (see Fig. 5), storm duration , (see Fig. 6) and the average number of hours with storms
  with a corresponding change in the nature of waves in the attenuation stage. Low values in the autumn season determine the trend towards the final erosion of the coastal profile for the majority of storm events. This trend has not been identified in the South-Eastern Baltic region. At the same time, the interseasonal dynamics of the index for the Western Kamchatka do not correspond to the result obtained when calculating the index (according to [5]). This indicates that coastal morphodynamics are predominantly affected by individual storms, rather than by the seasonal variation of wave intensity.
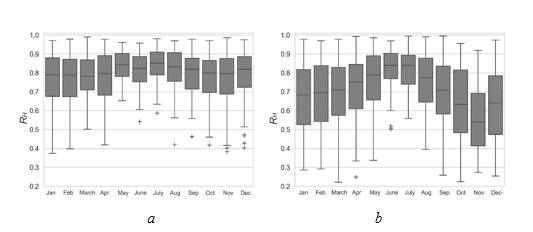
F i g. 8. Statistical characteristics of the change in index  during a year for the parts of water areas of the South-Eastern Baltic (a) and the Western Kamchatka (b) under study
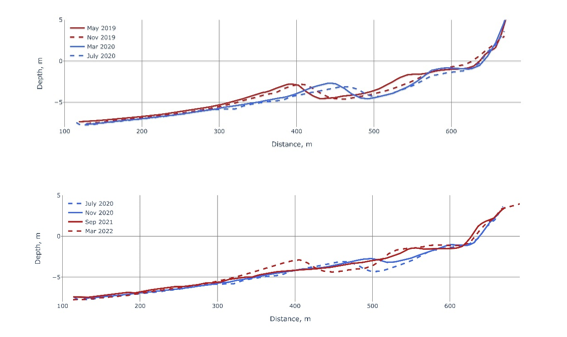
F i g. 9. Dynamics of the Vistula Spit coastal profile from May 2019 to March 2022
The results of the statistical analysis for the water areas under study by month were compared with the data on the sand profile morphodynamics in different seasons. Over the course of three years (from May 2019 to March 2022), relief measurements were taken on the Vistula Spit. They revealed that there are no coastal profile deformations in this section of the coast that can be characterized as seasonal. Throughout the observation period, a cycle involving the evolution of the underwater bar from a straightened outer one (May 2019) to a crescent-shaped one with subsequent adjoining to the coast (September 2021) (Fig. 9) was documented. In March 2022, a new outer underwater bar was formed. However, the typical seasonal morphodynamic rhythm, characterized by the coast’s retreat and the formation of an underwater bar during winter, followed by its subsequent adjoining to the coast in the form of an accumulative terrace during summer, remained unidentified.
On the Oktyabrskaya Spit, the relief was measured with less regularily and exclusively in the above-water portion of the coastal zone. The seaward boundary of the measurements passed above the waterline, approximately at the maximum wave run-up during the survey. Nevertheless, the seasonal rhythm of changes in the beach relief on this coast section was identifiable. The profile measured in June 2011 can be considered as summer one, since it is located higher in relation to other profiles and extends towards the sea (Fig. 10). Autumn brings an increase in waves, as well as beach erosion and the formation of a winter profile. This phenomenon is evident from the relative position of the profiles taken in November 2010 and September 2011. Thus, during storm seasons (November 2010 and September 2011), the average position of profile changes and a trend towards erosion is outlined. This corresponds to lower values of the coefficient.
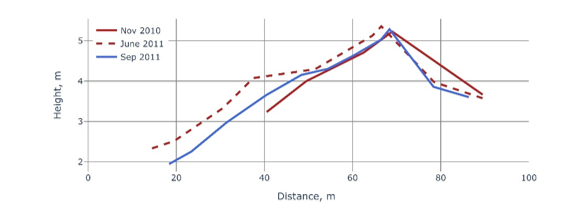
F i g. 10. Dynamics of the Oktyabrskaya Spit beach from November 2010 to September 2011
Conclusion
Using an example of two regions with different hydrodynamic characteristics (the waters of the South-Eastern Baltic and the eastern portion of the Sea of Okhotsk), it was found that seasonal fluctuations in the intensity of sea waves can be accompanied by varied features of storm events during the attenuation stage. It was revealed that the ratio of the median value of the storm wave height in the attenuation stage to its maximum height can vary for different seasons, as reflected by the proposed index. In turn, the index, which characterizes the relative duration of the storm attenuation stage, does not tend to seasonal variability.
A more “energetic” storm in the attenuation stage ( values are close to 1) can be regarded as a contributing factor to the post-storm recovery of the coastal profile. Variations in this factor on a seasonal scale can be considered as one of the possible causes for seasonal deformations in the accumulative relief of the coastal zone.
In particular, the coastal profile deformations that can be characterized as seasonal were revealed for the sandy coast of the Oktyabrskaya Spit (Western Kamchatka). In contrast, no such deformations were revealed for the South-Eastern Baltic. The observed variations in morphodynamics between these two regions are accompanied by a regular seasonal variation in the index for the wave conditions at the Oktyabrskaya Spit and the absence of seasonality in the values for the Vistula Spit conditions.
It has been demonstrated that the change in wave intensity throughout the year does not always entail a change in the average position of the coastal profile. The key factor may be the seasonal trends in the variation of wave parameters within the storm cycle. In particular, the role of storm wave energy in the attenuation stage is indicated. The approach we proposed is a variation of approaches to storm structure analysis suggested by other authors. These approaches suggest that the duration of the storm and the wave energy amount in the attenuation stage determine the volume of sediment transported towards the coast.
The proposed approach to assessing individual storm events can be scaled up to a series of storms or down to an individual season. A group of storms following the maximum wave intensity can be considered as storms in the attenuation stage, which can be assessed using the and indices adapted to a different time scale. Thus, based on long-term wave data, we can forecast the coastal profile recovery after typical seasonal erosions.
1. Yates, M.L., Guza, R.T., O’Reilly, W.C. and Seymour, R.J., 2009. Overview of Seasonal Sand Level Changes on Southern California Beaches. Shore & Beach, 77(1), pp. 39-46.
2. Katoh, K. and Yanagishima, S., 1988. Predictive Model for Daily Changes of Shoreline. In: B.L. Edge, ed., 1988. Coastal Engineering 1988. New York: American Society of Civil Engineers, pp. 1253-1264. https://doi.org/10.1061/9780872626874.094
3. Hansen, J.E. and Barnard P.L., 2010. Sub-Weekly to Interannual Variability of a High-Energy Shoreline. Coastal Engineering, 57(11-12), pp. 959-972. https://doi.org/10.1016/j.coastaleng.2010.05.011
4. Castelle, B., Marieu, V., Bujan, S., Ferreira, S., Parisot, J-P., Capo, S., Sénéchal, N. and Chouzenoux, T., 2014. Equilibrium Shoreline Modelling of a High-Energy Meso-Macrotidal Multiple-Barred Beach. Marine Geology, 347, pp. 85-94. https://doi.org/10.1016/j.margeo.2013.11.003
5. Splinter, K.D., Turner, I.L., Davidson, M.A., Barnard, P., Castelle, B. and Oltman-Shay, J., 2014. A Generalized Equilibrium Model for Predicting Daily to Interannual Shoreline Response. Journal of Geophysical Research: Earth Surface, 119(9), pp. 1936-1958. https://doi.org/10.1002/2014JF003106
6. Huguet, J.-R., Castelle, B., Marieu, V., Morichon, D. and de Santiago, I., 2016. Shoreline-Sandbar Dynamics at a High-Energy Embayed and Structurally-Engineered Sandy Beach: Anglet, SW France. Journal of Coastal Research, 75(sp1), pp. 393-397. https://doi.org/10.2112/SI75-079.1
7. Inman, D.L., Elwany, M.H.S. and Jenkins, S.A., 1993. Shorerise and Bar-Berm Profiles on Ocean Beaches. Journal of Geophysical Research: Oceans, 98(C10), pp. 18181-18199. https://doi.org/10.1029/93JC00996
8. Bernabeu, A.M., Medina, R. and Vidal, C., 2003. A Morphological Model of the Beach Profile Integrating Wave and Tidal Influences. Marine Geology, 197(1-4), pp. 95-116. https://doi.org/10.1016/S0025-3227(03)00087-2
9. Goodfellow, B.W. and Stephenson, W.J., 2005. Beach Morphodynamics in a Strong-Wind Bay: A Low-Energy Environment? Marine Geology, 214(1-3), pp. 101-116. https://doi.org/10.1016/j.margeo.2004.10.022
10. Elgar, S., Gallagher, E.L. and Guza, R.T., 2001. Nearshore Sandbar Migration. Journal of Geophysical Research: Oceans, 106(C6), pp. 11623-11627. https://doi.org/10.1029/2000JC000389
11. Price, T.D., Ruessink, B.G. and Castelle, B., 2014. Morphological Coupling in Multiple Sandbar Systems - A Review. Earth Surface Dynamics, 2(1), pp. 309-321. https://doi.org/10.5194/esurf-2-309-2014
12. Wright, L.D. and Short, A.D., 1984. Morphodynamic Variability of Surf Zones and Beaches: A Synthesis. Marine Geology, 56(1-4), pp. 93-118. https://doi.org/10.1016/0025-3227(84)90008-2
13. Dean, R.G., 1973. Heuristic Models of Sand Transport in the Surf Zone. In: First Australian Conference on Coastal Engineering, 1973: Engineering Dynamics of the Coastal Zone. Sydney, Australia: Institution of Engineers, pp. 215-221.
14. Castelle, B. and Masselink, G., 2023. Morphodynamics of Wave-Dominated Beaches. Cambridge Prisms: Coastal Futures, 1, e1. https://doi.org/10.1017/cft.2022.2
15. Grasso, F., Michallet, H., Certain, R. and Barthélemy, E., 2009. Experimental Simulation of Sandbar Dynamics. Journal of Coastal Research, 56(I), pp. 54-58.
16. Leont’yev, I.O., 2018. Modeling a Shore Profile Formed by Storm Cycle Impact. Oceanology, 58(6), pp. 892-899. https://doi.org/10.1134/S0001437018060085
17. Glukhovskii, B.Kh., Goptarev, N. and Terziev, F.S., eds., 1998. Hydrometeorology and Hydrochemistry of Seas. Volume IX. The Sea of Okhotsk. Issue 1. Hydrometeorological Conditions. Saint Petersburg: Gidrometeoizdat, 342 p. (in Russian).
18. Gorin, S.L., Ignatov, E.I., Kravchunovskaya, E.A., Kosonin, D.V. and Tembrel, I.I., 2012. The Morphodynamics of the Oktyabr’skaya Spit (Sea of Okhotsk Coast of Kamchatka). In: L. A. Zhindarev, 2012. “Sea Coasts” Working Group, 2012. XXIV International Coastal Conference “Sea Coasts – Evolution, Ecology, Economy” for the 60-th Anniversary of the “Sea Coasts” Working Group: in 2 Volumes. Vol. 1. Krasnodar: Yug Publishing, pp. 94-97 (in Russian).
19. Hersbach, H., Bell, B., Berrisford, P., Hirahara, S., Horányi, A., Muñoz-Sabater, J., Nicolas, J., Peubey, C., Radu, R. [et al.], 2020. The ERA5 Global Reanalysis. Quarterly Journal of the Royal Meteorological Society, 146(730), pp. 1999-2049. https://doi.org/10.1002/qj.3803
20. Shtremel, M., 2020. ERA5 Wave Data Verification with Buoy Field Measurements in the Nearshore Region of the Baltic Sea. In: M. Kalinowska, P. Rowiński, T. Okruszko and M. Nones, eds., 2020. Abstract Book of 6th IAHR Europe Congress (Warsaw Poland 2020). Warsaw, Poland: IAHR, pp. 433-434.
21. Larson, M. and Kraus, N.C., 1989. SBEACH: Numerical Model for Simulating Storm-Induced Beach Change. Report 1. Empirical Foundation and Model Development. Washington: US Army Corps of Engineers, 256 p. https://doi.org/10.5962/bhl.title.47893
22. Leontiev, I.O., 2001. Coastal Dynamics: Waves, Currents, Sediment Transport. Moscow: GEOS, 272 p. (in Russian).