


Россия
Россия
Purpose. The work is purposed at studying the spatial distribution, temporal variability and fluxes of particulate organic matter in the Black Sea based on numerical modeling. Methods and Results. A model of the lower trophic level of the Black Sea ecosystem is applied to estimate the spatial distribution and vertical fluxes of particulate organic matter in the upper 200-meter layer. To extend the study to the whole thickness of the Black Sea, a model consisting of an equation for the evolution of particulate organic matter concentration in the layer from 200 m to the bottom was developed. The hydrodynamic and thermodynamic fields obtained from the previous reanalysis are used as coefficients in this equation and in the equations of the ecosystem model. The modeling was carried out for the period 2016–2020. The concentrations and vertical fluxes of particulate organic matter are obtained on a regular grid and with a time resolution of 1 day. The particulate organic carbon fluxes derived from numerical modeling are compared with the results of processing the samples collected by the sediment traps at two points in the Black Sea. The simulation results are in a fairly good qualitative and quantitative agreement with the measurement results. Conclusions. A model for calculating the particulate organic matter content in the deep layers of the Black Sea was developed. The modeling results have shown that due to the biological processes, the particulate organic matter concentration in the surface layer of the Black Sea significantly exceeds that in the deep-sea layer. The magnitude of vertical particulate organic matter fluxes in the surface layer is conditioned mainly by the suspended matter concentration, whereas in the deep-sea layer – by the value of vertical velocity. Based on the modeling results, the carbon flux directed from the water column to the bottom was evaluated as a result of suspended matter settling. The main part of this flux falls on the shelf zone of the sea.
carbonate system, particulate organic matter, marine ecosystems, Black Sea, numerical modeling, sediment traps
Introduction
The spatial distribution, temporal variability and fluxes of particulate organic matter (POM) are of great importance in the study of the Black Sea carbonate system. The study of POM vertical distribution and its temporal variability was carried out in a number of works (e.g., , [1–3]). One of the main lines of such research is the study of particulate matter samples taken with stationary sediment traps. Currently, the work on the study of vertical particulate matter fluxes, including organic and inorganic carbon, is being carried out jointly by scientists from FSBSI FRC MHI and IO RAS [4, 5] on an ongoing basis. The measurement of particulate matter fluxes is conducted using stationary sediment traps at specific locations in the Black Sea, thereby limiting our understanding of the processes occurring in the sea. In order to obtain spatial distributions and temporal variations of carbonate system components, it is useful to apply numerical 3D models of the marine environment, which can be used for determining the temporal evolution and spatial distribution of the parameter of interest on a regular grid. This paper presents the numerical modeling results of the five-year evolution of particulate organic matter in the Black Sea in order to study the spatio-temporal variability of its concentration and vertical fluxes.
Materials and research method
Biological processes related to the functioning of the plankton community, based on the formation of primary production through the processes of photosynthesis and nutrient assimilation by phytoplankton, play an important role in the formation of POM, especially in the upper oxygenated layer of the sea. Therefore, in order to assess the spatial distribution and vertical fluxes of POM in the upper layer, we used a lower-level model of the food chain of the Black Sea ecosystem [6]. The biogeochemical part of the model is a system of 15 (depending on the number of state variables) transfer-diffusion equations, the right-hand sides of which contain terms describing biogeochemical interactions between the state variables.
The equation system of the biogeochemical part of the model includes current velocity fields as coefficients and turbulent exchange coefficients, which are output parameters of the Black Sea circulation model. In addition, the terms describing the interaction of the ecosystem components of the model use temperature and salinity fields, which are also output parameters of the hydrodynamic model. The unit of measurement for the state variables in the model is nitrogen. The fluxes of inorganic nitrogen compounds (nitrates and ammonium), proportional to their concentration and the intensity of river runoff, are specified at the mouths of large rivers. In order to convert the units of organic matter measurement from nitrogen to carbon, we have used the C:N mass ratios for various parameters of the Black Sea ecosystem taken from [7]. In the following, particulate organic matter is considered in units of carbon.
In this paper, the results of the reanalysis performed for the period 1993–2020 [8], based on a numerical model of the Black Sea circulation with assimilation of satellite measurements of sea surface temperature and sea level topography anomalies, were used as hydrodynamic and thermodynamic fields. The horizontal step of the model is 4.8 km, in the vertical direction the model grid has 35 z-levels, thickening towards the surface.
In the biogeochemical part of the model, the computational domain coincides horizontally with the domain of the circulation model (the grid steps also coincide) and vertically occupies the upper 200 m of the Black Sea (18 computational levels corresponding to the circulation model).
The described biogeochemical model provides POM distribution only in the upper 200 m layer of the sea. In order to extend the study to the entire water column of the Black Sea, an equation for the evolution of the POM concentration in the layer from 200 m down to the bottom was added:
where  is POM concentration;
 are components of current velocities;
  are coefficients of horizontal and vertical turbulent diffusion, respectively, derived from the circulation model;
  is sedimentation velocity as a function of depth;
  is a rate of change of POM concentration due to chemical processes. The sedimentation velocity varies between 0.4–2.5 m/day. The last term on the right-hand side of equation (1) describes the anaerobic degradation of POM. The horizontal grid and calculated levels correspond to the Black Sea circulation model. The source of POM for equation (1) is the upper 200-meter layer, where the ecosystem model operates. The POM concentration obtained there at the lower level (200 m) serves as a boundary condition for equation (1).
The main calculation of the POM concentration evolution was carried out for 5 years from 2016 to 2020. The following procedure was employed to prepare the initial fields for equation (1). The calculation was carried out according to equation (1) with zero initial conditions. In this case, the boundary conditions at the upper boundary and the equation coefficients (flow velocities) were set in the cycle for 2015. When the POM concentration fields at all horizons reached a stable state, the calculation was completed and the resulting fields were used as initials for the main calculation. This operation required about one hundred years of model time.
Results
After obtaining the initial conditions, a three-dimensional POM distribution was calculated over the entire Black Sea area. This resulted in a data array with a discretization of one day being obtained on a regular grid. Fig. 1 shows the temporal variability of the total POM in three layers: 0–56, 56–95 and 95–350 m. The first layer corresponds approximately to the depth of the photosynthetic layer in the Black Sea, the second layer corresponds to the subanaerobic zone, and the third layer corresponds to the hydrogen sulfide zone (see reference [1]). This study examined the distribution of particulate organic carbon (POC) based on the sample data from 11 stations of the 26th cruise of the R/V Vityaz in 1992. The main maximum in the 0–56 m layer occurs around March during the diatom “bloom”. In the lower layers this maximum becomes smaller and shifts to the right in time according to the sedimentation of particulate matter.
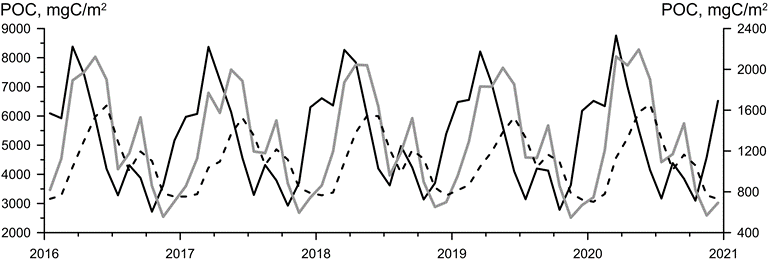
F i g. 1. Temporal variability of total particulate organic carbon in three layers: 0–56 m (black line), 56–95 m (gray line), and 95–350 m (dashed line). The left ordinate axis refers to the 0–56 m layer, and the right one – to the other two layers. The graphs are constructed based on the results of numerical modeling
The study [1] provides the average POC content in these layers – 4.7, 1.0 and 7.9 g. The study [9], which examines the results of measurements in the Black Sea southwestern part, provides similar values. The corresponding values derived from the data in Fig. 1 are 5.2, 1.3 and 1.1 g. While the first two layers demonstrate a reasonable degree of similarity with the measurement results, it should be noted that the measurements were taken for a different time period. For the hydrogen sulfide zone, however, it was found that the modeling results were underestimated.
Fig. 2, a demonstrates vertical profiles of POC averaged over the area and for a period of 5 years for the entire basin and shelf. The profile averaged over the entire Black Sea water area has a maximum value of ~ 120 mg/m3 in the upper 20-meter layer. The maximum value recorded at the shelf exceeds 200 mg/m3. A POC profile obtained through averaging all measurements is presented in [1]. In the upper 20-meter layer, the POC values have a maximum of 142 mg/m3, which is between the maximum values for the entire water area of the sea and the shelf derived from numerical modeling results.
The POC distributions that had been calculated were then used to construct fields of monthly average fluxes (F) of inorganic carbon directed downwards for all model horizons. The calculation of these fluxes is outlined below. The F value was summed up over the month at each point of the model grid and calculated horizon:  for
for  and
and  for
for  , where
  is POC concentration;
  is liquid velocity, and
  is sedimentation velocity of organic carbon particles. It is important to note that the velocity is positive if it is directed from the surface towards the bottom. The obtained value was then divided by the number of days in the month. This method for determining the POC flux was selected to ensure the comparison of modeling results with measurement results obtained during the cruises of the R/V Professor Vodyanitsky, using sedimentation traps, where sampling was conducted with a one-month exposure. These samples were then applied to study the characteristics of the vertical flux of organic and inorganic carbon [10].
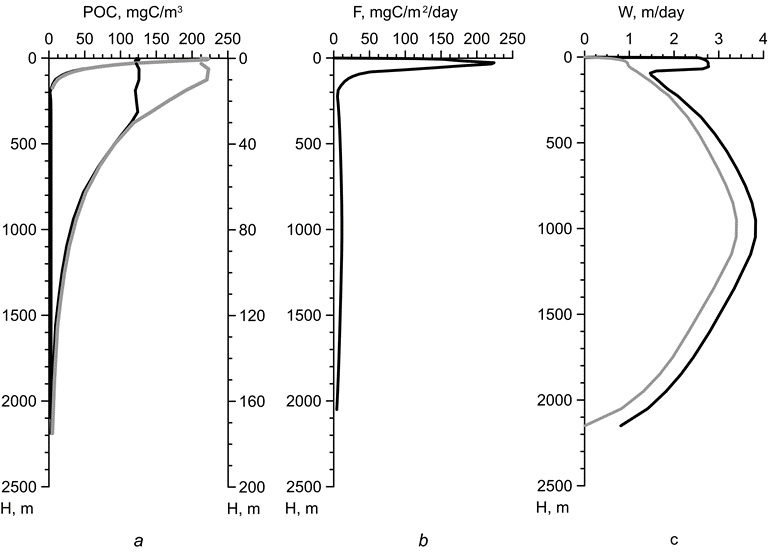
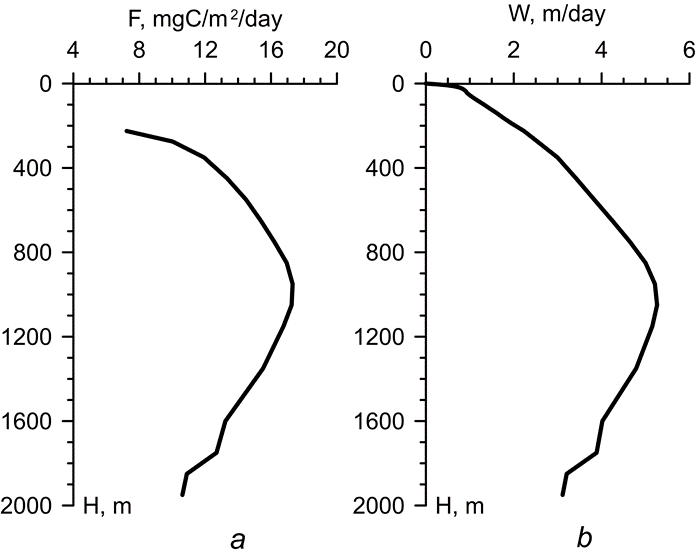
F i g. 2. Vertical profiles of POC for the whole water column (left ordinate axis) and the upper 200-meter layer (right ordinate axis) averaged over the whole basin (black line) and shelf (gray line) (a); profile of the POC vertical flux (b); profiles of the liquid average vertical velocity directed towards the bottom (gray line), and the liquid velocity plus the sedimentation velocity (black line) (c). All the profiles are constructed based on the results of numerical modeling
The vertical flux profile of POC, averaged over the entire Black Sea area and for a 5-year time interval, is shown in Fig. 2, b. Similar profiles of the liquid vertical velocity and the sum  are presented in Fig. 2, c. The vertical flux profile of POC in the upper 100-meter layer exhibits a maximum that is at least an order of magnitude greater than the values of the average fluxes below 200 m. The average vertical velocity within the entire layer varies by a maximum of 3 times (excluding the horizons near the surface and at the bottom), and the sum varies by a maximum of 4 times. The local maximum of the latter in the upper 100-meter layer is explained by the high sedimentation velocity in this layer. The POC concentration in the near-surface sea layer is also significantly higher than in the layer below 200 m where the average concentration varies insignificantly. Consequently, it can be deduced that the average vertical flux of POM in the surface layer is predominantly determined by the POC concentration, while in the layer below 200 m, it is primary influenced by the vertical velocity.
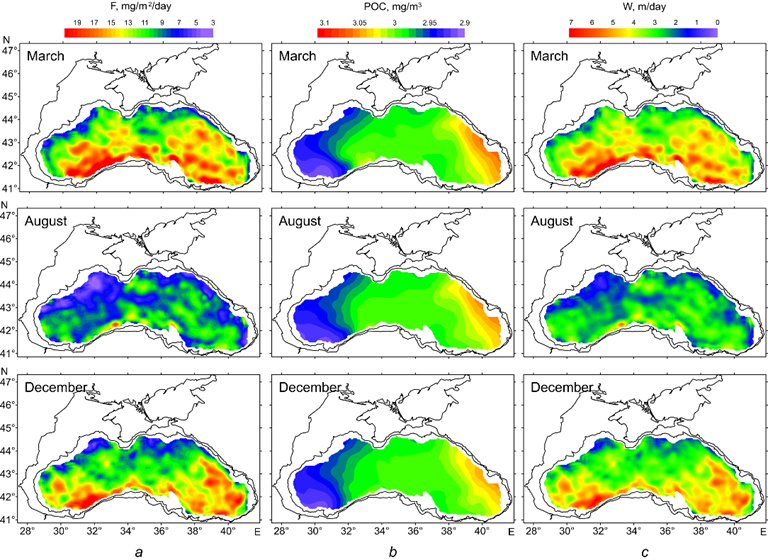
The monthly average maps of POC flux distribution, its concentration and vertical velocity at the 30 m horizon given in Fig. 3 were obtained by averaging over a 5-year period, with data from three months (March, August and December) being used to create the maps. In March, the POC concentration is elevated throughout the Black Sea (~ 150 mg/m3), and accordingly, the vertical POC fluxes also exhibit elevated values (~ 300 mg/m2/day) across the entire water area. In contrast, the POC concentration in August is notably lower than in March, and the vertical fluxes are also lower, particularly in the western part of the sea. The lowest values of POC concentration and vertical fluxes are observed in December. Therefore, at the 30-m horizon, the values of POC vertical fluxes correlate well with its concentration. This confirms the preceding conclusion that, within the near-surface layer of the Black Sea, vertical POC fluxes are predominantly determined by its concentration. In addition, the vertical velocity (Fig. 3, c) exhibits its lowest values in August, while the lowest fluxes are observed in December (Fig. 3, a). At the same time, the spatial variability of vertical velocity significantly affects the spatial distribution of fluxes. For instance, in March, elevated values of vertical velocity are observed along the basin periphery, which coincide with the increased POC flux values in these locations. Furthermore, in December, elevated vertical velocities and increased values of POC fluxes are observed along the deep-water section of the western coast and the southern coast of the Black Sea.
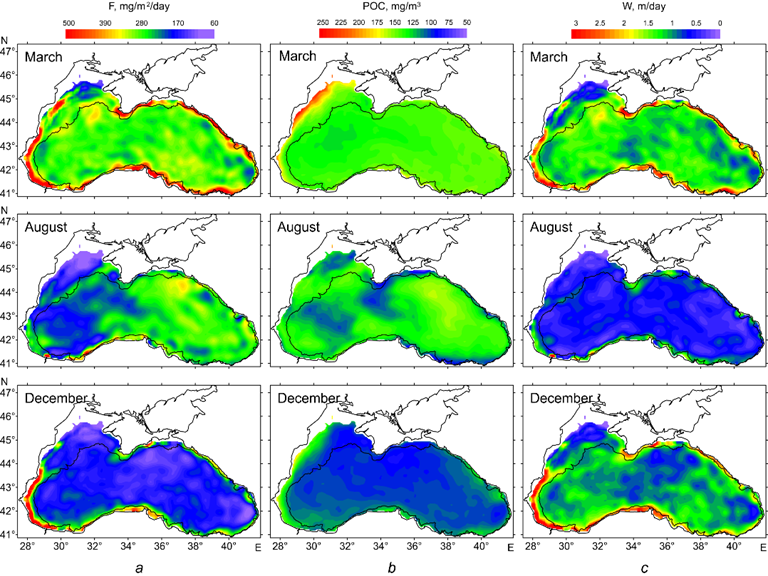
F i g. 3. Maps of distribution of POC fluxes (a) and concentration (b), and liquid vertical velocity directed downwards (c) for the 30 m horizon based on the results of numerical modeling
F i g. 4. The same as in Fig. 3 for the 1200 m horizon
At the 1200 m horizon, the POC concentration is practically independent of the month (Fig. 4). Spatial variability is minimal; thus, the vertical velocity of the liquid contributes most significantly to the vertical fluxes. In August, the lowest of vertical velocities shown in Fig. 4, c is observed, and the weakest vertical POC fluxes are also observed in the same month. The spatial distribution of vertical fluxes is found to coincide with that of vertical velocity.
The study [11] presents the analysis results of the material collected during the sediment trap experiment carried out near the town of Amasra, Turkey, in the deep-water part of the Black Sea. The experiment, which lasted three years from October 1982, involved the use of two sediment traps installed at depths of 250 and 1200 m. The study revealed that the total suspended matter flux in the deep-water trap was higher than that in the shallower one. The POC flux in the former reached a maximum of ~ 40 mg/m2/day and ~ 20 mg/m2/day in the shallower one, respectively.
As illustrated in Fig. 5, the temporal variability of the POC fluxes obtained from the modeling results is presented for the specified horizons at a grid node with coordinates 42.063°N and 32.362°E. Despite the modeling results relating to a different time period, the main features noted in [11] are also preserved for them. These include the vertical POC flux at the 1200 m horizon being greater than at the 250 m horizon for almost the entire modeling period. Its maximum values reached ~ 40 mg/m2/day, while at the 250 m horizon they reached ~ 20 mg/m2/day.
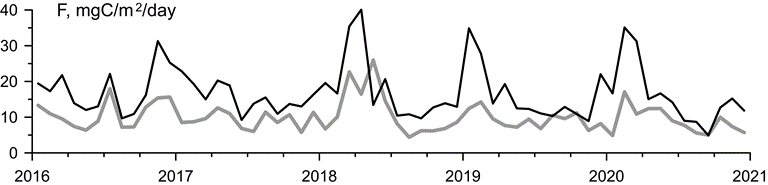
F i g. 5. Graphs of time variability of POC fluxes in the model computational grid node (coordinates are 42.063° N and 32.362° E) at the 250 m (gray line) and 1200 m (black line) horizons
F i g. 6. Profiles of POC flux (a) and vertical velocity (b) for the model computational grid node (coordinates are 42.063° N and 32.362° E)
The maps in Fig. 4 demonstrate that in the area of coordinates indicated in Fig. 5, elevated values of vertical velocity and, consequently, of the POC fluxes are observed for all months. Fig. 6 presents a comparison of vertical velocity and POC flux profiles derived from the averaging of the entire integration period. The average vertical velocity directed downwards reaches its maximum value at a depth of ~ 1000 m, and the vertical POC flux also exhibits a maximum at a similar depth. This indicates that the nature of currents in this area of the Black Sea is such that at a depth of 1200 m, the vertical flux is noticeably greater than at a depth of 250 m.
In recent years, sampling with sediment traps has been carried out on a continuous basis. The study [10] presents some results of processing the samples obtained using traps installed in the deep-water part of the Black Sea in the section between Cape Chersonesos and the Bosphorus Strait at a point with 43.8°N and 32.1°E coordinates at depths of 150 and 1700 m in November 2018. Sampling was conducted on a year-round basis, with a specified exposure duration of 1 month. The mean vertical POC flux for the entire measurement period, based on the results of sample processing, was 1.9 mg/m2/day for the 150 m horizon and 6.57 mg/m2/day for the 1700 m horizon. This finding indicates that the POC flux values are higher in the deep horizon than in the shallow one.

F i g. 7. Temporal variability of POC fluxes in the model computational grid node (coordinates are 43.8°N and 32.1°E) at the 150 m (gray line) and 1700 m (black line) horizons
The vertical fluxes for 2019, as illustrated in Fig. 7, were obtained from the modeling results. It is evident from the figure that the fluxes are generally higher at the 150 m horizon (with the exception of a few months) in comparison to the 1700 m horizon. The mean flux values were found to be 6.95 mg/m2/day at 150 m depth and 5.8 mg/m2/day at 1700 m depth. Thus, the mean value of vertical POC flux at the deep horizon, as determined by the modeling results, is close to the measured value. However, at the 150 m horizon, the modeling results exceed the measured values.
Based on the obtained fields it is possible to estimate an amount of particulate carbon that settles to the bottom and is thereby removed from the Black Sea carbonate system. Given that the liquid vertical velocity at the seabed is zero due to the impermeability condition, the vertical flux of particulate carbon at each point on the seabed will be equal to  , where
  is concentration of particulate carbon in the bottom cell. Fig. 8 illustrates the total flux of particulate carbon towards the Black Sea bottom for the entire water area and the shelf zone. The flux values for the shelf and the entire sea are almost identical. This observation indicates that the sedimentation of particulate carbon to the bottom mainly occurs on the shelf due to the fact that in a significant part of the NWS the depth is less than 50 m. At these depths, the concentration of POC exceeds the corresponding values in the deeper layers of the sea by two orders of magnitude. The maximum settling to the bottom occurs approximately in March, which corresponds to the maximum total POC content in the photosynthetic layer (Fig. 1).
The distribution of POC settling fluxes to the Black Sea bottom for March (maximums on the graphs in Fig. 8) and for July (minimums) is illustrated in Fig. 9. It is evident that settling to the bottom in the shelf area significantly exceeds the amount observed in the deep-water part of the sea. The mean value of carbon loss due to settling is (according to the graph in Fig. 8) 3.1·106 t/year (2.83·106 t/year at the shelf). In [11], the influx of POC into the Black Sea via river runoff was estimated at 2.6·106 t/year, which turned out to be close to the value of settling to the bottom derived from the modeling results.
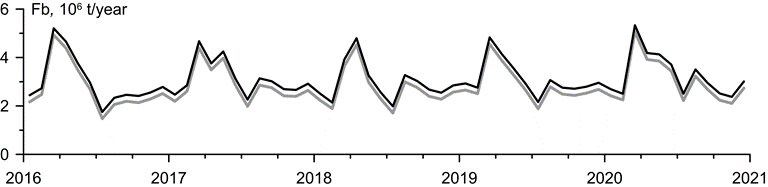
F i g. 8. Total flux of POC settling to the Black Sea bottom (black line) and shelf (gray line) based on the results of numerical modeling
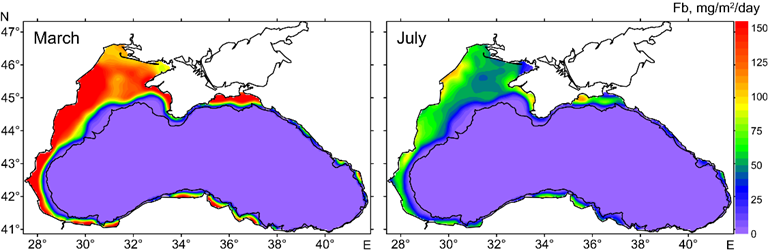
F i g. 9. Maps of distribution of POC settling fluxes to the Black Sea bottom for two months based on the results of numerical modeling
Conclusion
The work considers the developed model for calculation of the POM content in the deep layers of the Black Sea. For calculating the POM in the upper 200-meter layer, the existing model of the food chain lower level of the Black Sea ecosystem is applied. The results of this model are then used at the lower horizon as boundary conditions for computation the organic carbon concentration in the underlying layers.
A model computation was performed over a 5-year period, resulting in the acquisition of POC concentrations on a regular grid with a temporal resolution of 1 day. The modeling results indicate that the concentration of particulate organic matter in the surface layer of the Black Sea is significantly higher than in the deep-water layer, owing to the impact of biological processes.
The vertical POC fluxes were computated using the model fields of POC concentration and hydrodynamic fields from the Black Sea circulation model. As with the concentrations, the flux values are significantly higher in the Black Sea surface layer. The vertical POC flux in the surface layer is determined primarily by particulate matter concentration, while in the deep-water layer, it is determined by the vertical velocity directed downwards. This conclusion is confirmed by the distribution maps of average concentrations, POC fluxes and vertical velocity at the 30 and 1200 m horizons. However, it is notable that the spatial distribution of POC flux, even at the 30 m horizon, can exhibit a significant correlation with the vertical velocity distribution.
The results of numerical modeling of POC fluxes were compared with the results of processing the samples collected with sediment traps at two points in the Black Sea. The modeling results have demonstrated a relatively strong qualitative and, in certain cases, quantitative agreement with the measurement results.
Based on the modelling results, the carbon flux from the water column to the bottom was estimated as a result of suspended matter settling. The predominant part of this flux is concentrated within the shelf zone of the sea.
1. Lyutsarev, S.V. and Shanin, S.S., 1996. Peculiarities of Particulate Organic Carbon in the Black Sea Water Column. Oceanology, 36(4), pp. 538-542 (in Russian).
2. Burlakova, Z.P., Eremeeva, L.V and Konovalov, S.K., 2000. Seasonal and Spatial Variability of the Content of Suspended Organic Substances in the Active Layer of the Black Sea. Physical Oceanography, 10(5), pp. 419-454. https://doi.org/10.1007/BF02515365
3. Burlakova, Z.P., Eremeeva, L.V and Konovalov, S.K., 2003. Budget and Fluxes of Particulate Organic Carbon and Nitrogen According to the Data on Vertical Distribution in the Deep Part of the Black Sea. Physical Oceanography, 13(3), pp. 157-170. https://doi.org/10.1023/A:1025094902673
4. Klyuvitkin, A.A., Kozina, N.V., Redzhepova, Z.Yu., Rusanov, I.I., Torgunova, N.I. and Bud’ko, D.F., 2017. Geological Study of the Black Sea (Cruise 81 of the R/V Professor Vodyanitskiy). Oceanology, 57(5), pp. 759-761. https://doi.org/10.1134/S0001437017050095
5. Klyuvitkin, A.A., Garmashov, A.V., Latushkin, A.A., Orekhova, N.A., Kochenkova, A.I. and Malafeev, G.V., 2019. Comprehensive Studies of the Black Sea during the Cruise 101 of the R/V Professor Vodyanitskiy. Oceanology, 59(2), pp. 287-289. https://doi.org/10.1134/S0001437019020097
6. Dorofeev, V.L. and Sukhikh, L.I., 2019. Studying Long-Term Variations in Black-Sea Ecosystem Based on the Assimilation of Remote Sensing Data in a Numerical Model. Water Resources, 46(1), pp. 65-75. https://doi.org/10.1134/S0097807819010032
7. Greґgoire, M., Raick, C. and Soetaert, K., 2008. Numerical Modeling of the Central Black Sea Ecosystem Functioning during the Eutrophication Phase. Progress in Oceanography, 76(3), рр. 286-333. https://doi.org/10.1016/j.pocean.2008.01.002
8. Dorofeev, V.L. and Sukhikh, L.I., 2023. Analysis of Long-Term Variability of Hydrodynamic Fields in the Upper 200-Meter Layer of the Black Sea Based on the Reanalysis Results. Physical Oceanography, 30(5), pp. 581-593.
9. Karl, D.M. and Knauer, G.A., 1991. Microbial Production and Particle Flux in the Upper 350 m of the Black Sea. Deep Sea Research Part A. Oceanographic Research Papers, 38(Suppl. 2), pp. S921-S942. https://doi.org/10.1016/S0198-0149(10)80017-2
10. Mukoseev, I.N., Gurova, Yu.S. and Orekhova, N.A., 2023. Flows of Carbon with Suspended Matter in the Black Sea. In: MHI, 2023. Seas of Russia: From Theory to Practice of Oceanological Research: Proceedings of All-Russian Scientific Conference (Sevastopol, 25–29 September 2023). Sevastopol, pp. 276-277 (in Russian).
11. Izdar, E., Konuk, T., Ittekkot, V., Kempe, S. and Degen, E.T., 1987. Particle Flux in the Black Sea: Nature of the Organic Matter. Mitteilungen aus dem Geologisch-Paläontologischen Institut der Universität Hamburg, (62), pp. 1-18.