


Россия
Россия
Россия
Purpose. Monitoring of coccolithophore “bloom” is becoming increasingly important due to their influence on the biogeochemical cycles. The purpose of the study is to analyze the frequency, intensity and area of Gephyrocapsa huxleyi “bloom” in different sub-regions of the Black Sea, as well as to assess the effect of environmental conditions on the intensity and interannual variability of “bloom”. Methods and Results. Based on the satellite data and using the regional algorithms, the values of chlorophyll a concentration, the particulate backscattering coefficient and the coefficient of light absorption by colored detrital matter were retrieved with a two-week averaging for different Black Sea sub-regions for the period 1998–2023. Application of the normalized anomalies made it possible to reveal the annual cycles of variability of these parameters, as well as to identify their common patterns and variability features in particular sub-regions of the sea. Conclusions. It has been established that in early June in all the regions of the sea, the “bloom” of Gephyrocapsa huxleyi was regularly observed; at that it was characterized by a year-to-year variability in its intensity and area. High light intensity in the sea upper mixed layer is a key factor for a shift in the phytoplankton species structure and for the transition to Gephyrocapsa huxleyi dominance and “bloom” due to the physiologically determined ability of these algae to grow at an extremely high light intensity with no inhibition, whereas at similar light conditions the growth of other plankton microalgae is suppressed. In most sub-regions of the Black Sea, the “bloom” of Gephyrocapsa huxleyi is not followed by an increase in the phytoplankton biomass, only the structure of phytoplankton species changes. The exception is the coastal waters affected by the river runoffs: the “bloom” there is observed when the phytoplankton biomass grows. In the coastal waters during a cold period (December, February), the Gephyrocapsa huxleyi abundance sometimes increases due to a decrease of nutrient supply that results from weakening of the river runoffs and/or increasing stability of the water column. Decrease in phytoplankton supply with nutrients contributes to the competitive growth of coccolithophores as compared to other types of phytoplankton. The development of Gephyrocapsa huxleyi “bloom” in different seasons can reflect its genetic and physiological plasticity.
coccolithophores, Gephyrocapsa huxleyi, Emiliania huxleyi, coccolithophore “bloom”, water bloom, chlorophyll concentration, light scattering, light absorption, colored detrital matter, remote sensing, Black Sea
Introduction
Coccolithophores (Coccolothophyceae) are planktonic haptophyte algae that are ubiquitous throughout the World Ocean [1]. Their distinctive feature is calcareous (CaCO3) plates – coccoliths – covering the entire cell surface. The most extensively studied species of this group is Gephyrocapsa huxleyi (Lohmann) P. Reinhardt, 1972 syn. Emiliania huxleyi (Lohmann) W.W. Hay & H. Mohler 1967.The massive development of this species is periodically recorded in different areas of the ocean, that leads to a powerful sea blooming, covering an area of hundreds of thousands of square kilometers [1, 2].
Coccolithophores are important producers of organic matter in the ocean, with an estimated contribution to primary production of 1–10%. They also play a crucial role in the downward transport of CaCO3 and the formation of calcareous bottom sediments [3, 4]. The optical characteristics of the sea are subject to significant change as a result of the accumulation of coccospheres and coccoliths in the water [2, 3]. It is predicted that current climate changes may significantly affect the growth of coccolithophores and calcification processes, in different ways at low and high latitudes [5, 6]. Over the past two decades, a significant increase in the number of coccolithophores has been noted in the Atlantic Ocean [7, 8]. Due to the essential impact of these microalgae on the global carbon cycle [5, 6, 9], the study of G. huxleyi “blooms” remains a priority [2].
In the most general terms, a “bloom” can be defined as the accumulation of phytoplankton biomass within a certain water area as a result of the microalgae growth rate exceeding the cell loss rate. The cell loss is determined by the natural mortality of algae and the consumption by zooplankton. Following an increase in biomass, values return to levels close to the baseline [10]. Commonly, there is an outbreak of one (monospecific “bloom”) or 2–3 species of microalgae, accompanied by an increase in phytoplankton biomass, lasting between a week and a month [11, 12]. A high degree of dominance by a single taxon is an important sign of “bloom”, and it is determined by the capacity of certain species to grow faster than other algae species under given environmental conditions [11, 13, 14].
Spring phytoplankton “bloom”, which are regularly observed in mid- and high-latitude regions, are associated with the rapid growth of diatoms against the background of favorable light conditions, abundant nutrient availability, and weak grazing pressure typical of that season [15–17]. The growth rate of diatoms reaches a maximum under conditions of intense vertical mixing of waters at high dissolved inorganic nutrient concentrations in the environment [13, 18]. The accumulation of algal biomass persists until the number of zooplankton feeding on them enhance in response to an increase in food availability and/or when nutrient supply becomes depleted [19]. The identification of the “bloom” and its subsequent dynamics analysis are based on the phytoplankton biomass, which is often recorded using the concentration of the main photosynthetically active pigment, chlorophyll a, as a marker [11].
In contrast to the spring “bloom” of diatoms, massive development of coccolithophores is typically not accompanied by a meaningful increase in phytoplankton biomass [20, 21]. Accordingly, the criterion for identifying the “bloom” of G. huxleyi is based on its abundance, with a threshold value of 1 million cells per liter. The G. huxleyi “bloom” typically occurs in the context of elevated solar radiation and limited availability of nutrients [1–3].
Regular studies carried out in the Black Sea over a two-years period revealed a change in the species composition of phytoplankton in late spring – early summer, with a constant chlorophyll a concentration [20]. In May, dinoflagellates formed the majority of phytoplankton, while coccolithophores contributed up to 80% of the phytoplankton biomass in June [20]. Furthermore, high abundances of G. huxleyi, exceeding a million cells per liter, have been recorded in coastal and shelf waters, as well as during the cold season [22].
Remote sensing methods offer a broad range of opportunities for the study of water quality and productivity at different temporal and spatial scales. The remote diagnostic of coccolithophore “blooms” is based on the unique optical characteristics of their cells, which exhibit an order of magnitude higher backscattering index (bbp) compared to other microalgae due to a high refractive index of coccoliths and coccosphere [23]. Satellite data have demonstrated that coccolithophore “blooms” in the Black Sea are observed annually at the beginning of summer [24–28]. However, the intra-annual dynamics of G. huxleyi concentrations in different regions of the Black Sea have not been sufficiently studied yet, as well as their relationship with chlorophyll a concentration (a marker of phytoplankton biomass) and the effect of environmental factors on these dynamics.
The following regional satellite algorithms have been developed for the Black Sea: 1) retrieval of primary hydrooptical properties of the sea surface layer [29], including bbp; 2) assessment of the chlorophyll a (Ca) concentration [30]. These allow analysis of the seasonal and interannual dynamics of these parameters in different areas of the sea, their relationship with environmental characteristics, such as sea surface temperature (SST), depth of the upper mixed layer (ZUML) and photosynthetically available radiation incident on the sea surface (PAR0).
The aim of this study is to investigate the frequency, intensity, and area of the Gephyrocapsa huxleyi “bloom” in different parts of the Black Sea, as well as to evaluate the impact of environmental factors on the strength and interannual variation of blooming events.
Methods
The bbp value at 555 nm (bbp (555)) was estimated from satellite data using a regional model [29]. The G. huxleyi cell concentration (NEh) was determined from the NEh versus bbp (555) dependence established from in situ NEh data [31].
The values of Ca and light absorption coefficient by colored detrital matter at 490 nm (aCDM(490)) were estimated based on satellite data using regional algorithm [30]. The ZUML values were determined according to [32].
For the Black Sea sub-regions (Fig. 1), as identified according to hydrophysical features [33], the mean values of the studied parameters were calculated with two-week averaging for the period 1998–2023. A 2-km zone along the entire Black Sea coast was excluded from the analysis. To assess the seasonal dynamics of bbp(555), NEh, SST, Ca, aCDM(490) and ZUML, the monthly mean anomalies normalized by the standard deviation ( ), were used:
 , (1)
, (1)
where X is the parameter under consideration;  is its monthly mean for the i month and j region;
  and
and  are the long-term mean and its standard deviation (SD) for the j region.
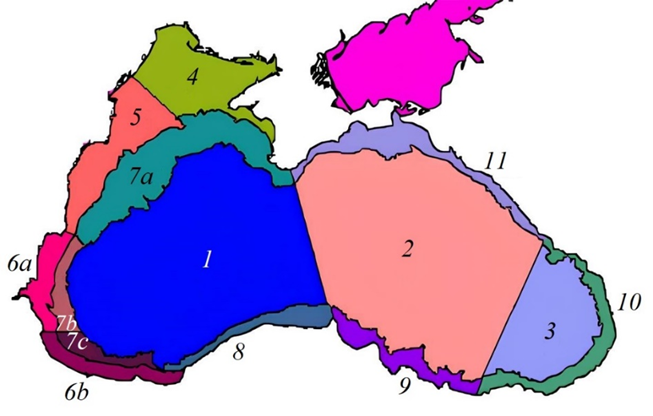
F i g. 1. Map of Black Sea sub-regions defined by hydrodynamic features [33]
The interannual variability of the X parameter was estimated using annual averages of monthly mean anomalies normalized by SD ( ), which was calculated as follows:
 ,
,
where  is its monthly mean for the i month, y year and j region;
  and
and  is the long-term mean and SD for the i month and j region.
Radiance within the upper mixed layer was determined from PAR0 (SeaWiFS and MODIS spectroradiometer data) using the relationship between the depth of the photosynthetic zone (Z1%) and ZUML. Z1% values were estimated from the diffuse attenuation index of light at 490 nm wavelength, reconstructed from SeaWiFS and MODIS satellite data, according to [34].
Results
Data series (bbp(555), NEh, SST, Ca, aCDM(490) and ZUML), calculated with two-week averaging for each sea sub-region (Fig. 1) from 1998 to 2023, were obtained. Fig. 2 shows the dynamics of bbp(555) in each sub-region over the specified period. Seasonal and interannual variability in this parameter are evident in all sub-regions (Fig. 2).
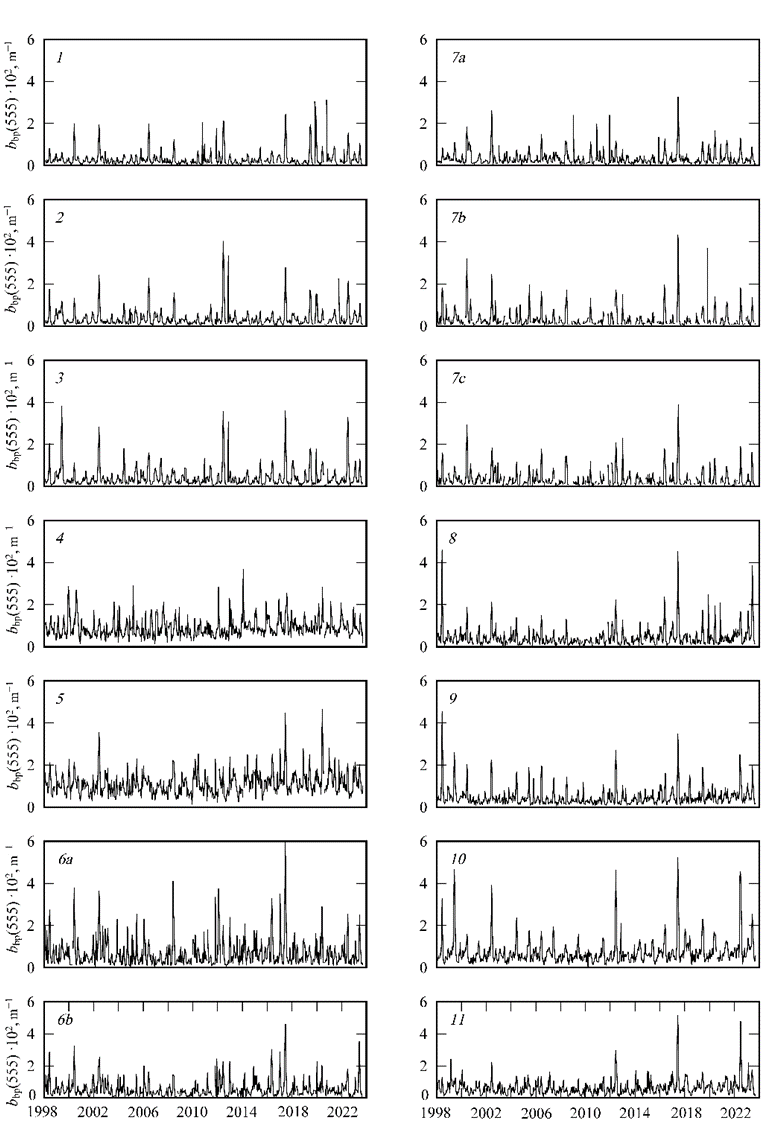
F i g. 2. Dynamics of two-week averages of particulate back scattering coefficient at wavelength 555 nm (bbp(555)×102) calculated for the sub-regions of the Black Sea (in this and the following figures, the region number is in the upper left corner of each fragment)
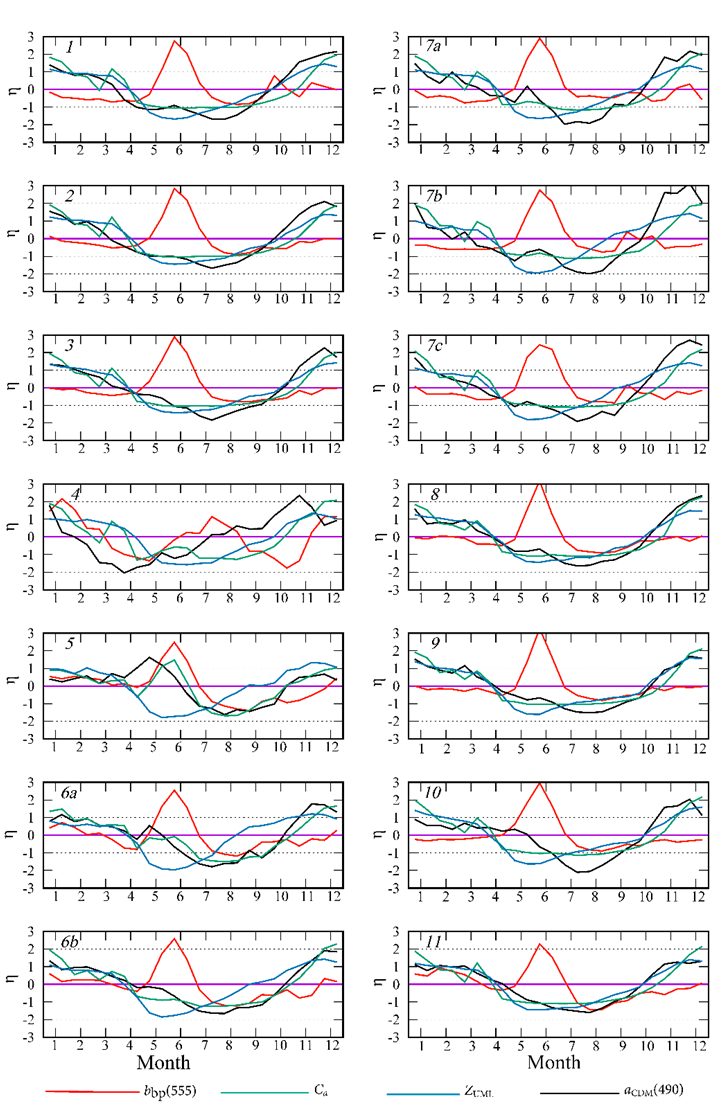
F i g. 3. Normalized monthly mean anomalies (η) of the particulate backscattering coefficient at wavelength 555 nm (bbp(555)), concentration of chlorophyll a (Ca), thickness of the upper mixed layer (ZUML), coefficient of light absorption by colored detrital matter at wavelength 490 nm  in particular sub-regions of the Black Sea
Normalized anomalies allow the identification of intra-annual cycles in all parameters (Fig. 3). The peak value of bbp(555) is recorded in June with a high probability (normalized anomaly exceeding 2) in almost all sub-regions. On the northwestern shelf (region 4), the bbp(555) maximum is observed in different months throughout summer, which reduces the statistical probability of its occurrence (normalized anomaly about 1) (Fig. 3). In the Black Sea, Ca concentrations are lowest in summer, except for areas affected by the Danube, Dnieper and Dniester runoff (sub-regions 4, 5 and 6, a). In these sub-regions an increase in Ca levels is observed during summer months (Fig. 3). The long-term means of the ( ) and SD ( ) (see Table) together with the annual dynamics of the normalized anomalies (see Fig. 2) allow us to calculate the monthly averages of each parameters in a specific sub-region of the sea using equation (1). In the deep-water sub-regions (sub-regions 1–3), the monthly long-term mean of Ca in June was between 0.15 and 0.25 mg×m−3.
A comparison of the annual cycles of bbp(555) and Ca revealed no relationship between these parameters (Fig. 3). The regularly observed maximum of bbp(555) in June is not accompanied by an increase in Ca values in all the sea sub-regions, with the exception of coastal waters subject to the Danube, Dnieper and Dniester runoff (sub-regions 4, 5, 6, a), where the summer maximum of bbp(555) is observed against a spring-summer Ca increase (Fig. 3). In these sub-regions (4, 5 and 6, a), the bbp(555) values demonstrate an inverse proportionality to the Ca values (Fig. 4).
Long-term average values of chlorophyll a concentration (Ca), mg×m‑3, light absorption coefficient by colored detrital matter at wavelength 490 nm ( ), m−1, and concentration of G. huxleyi cells (NEh), mln cell×l-1
calculated for the water upper layer in different regions of the Black Sea
|
Region |
aCDM(490) ± SD |
Ca ± SD |
NEh ± SD |
|
1 |
0.050 ± 0.045 |
0.69 ± 0.50 |
0.32 ± 0.30 |
|
2 |
0.051 ± 0.046 |
0.69 ± 0.50 |
0.36 ± 0.38 |
|
3 |
0.056 ± 0.051 |
0.67 ± 0.49 |
0.42 ± 0.45 |
|
4 |
0.112 ± 0.107 |
0.91 ± 0.79 |
0.91 ± 0.93 |
|
5 |
0.134 ± 0.133 |
1.43 ± 1.36 |
1.12 ± 1.17 |
|
6a |
0.109 ± 0.104 |
0.96 ± 0.86 |
0.69 ± 0.71 |
|
6b |
0.090 ± 0.083 |
0.75 ± 0.63 |
0.57 ± 0.59 |
|
7a |
0.058 ± 0.055 |
0.68 ± 0.58 |
0.35 ± 0.37 |
|
7b |
0.062 ± 0.056 |
0.66 ± 0.56 |
0.35 ± 0.35 |
|
7c |
0.064 ± 0.057 |
0.64 ± 0.53 |
0.37 ± 0.38 |
|
8 |
0.077 ± 0.070 |
0.69 ± 0.56 |
0.47 ± 0.47 |
|
9 |
0.074 ± 0.069 |
0.65 ± 0.55 |
0.48 ± 0.50 |
|
10 |
0.084 ± 0.077 |
0.68 ± 0.57 |
0.73 ± 0.79 |
|
11 |
0.068 ± 0.064 |
0.60 ± 0.50 |
0.64 ± 0.67 |
N o t e: SD is standard deviation.
An increase in Ca and  is observed in the northwestern shelf (sub-region 4) in May – June (Fig. 3). In the area of the Danube mouth (sub-region 5), this increase is more pronounced, and the normalized values of the anomalies of these parameters exceed 1 (Fig. 3).
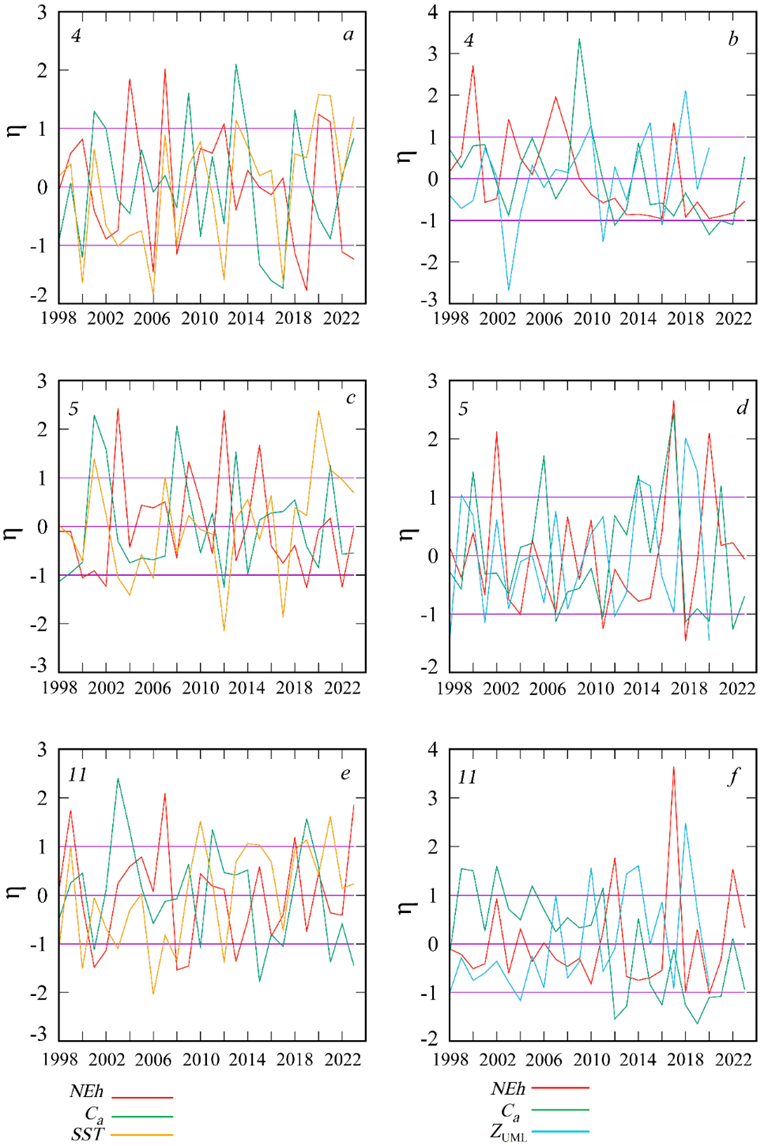
F i g. 4. Interannual variability of normalized monthly mean anomalies (η) of G. huxleyi cell abundance (NEh), chlorophyll a concentration (Ca), sea surface temperature (SST), and thickness of the upper mixed layer (ZUML) in February (a, c, e), June (d, f) and August (b) in sub-regions 4, 5 and 11
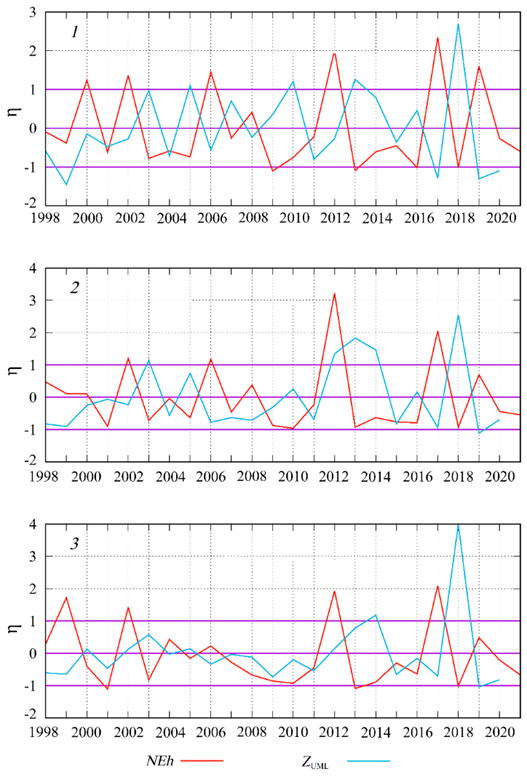
F i g. 5. Interannual variability of normalized monthly mean anomalies (η) of G. huxleyi cell abundance (NEh) and thickness of the upper mixed layer (ZUML) in June in sub-regions 1, 2 and 3 in the Black Sea
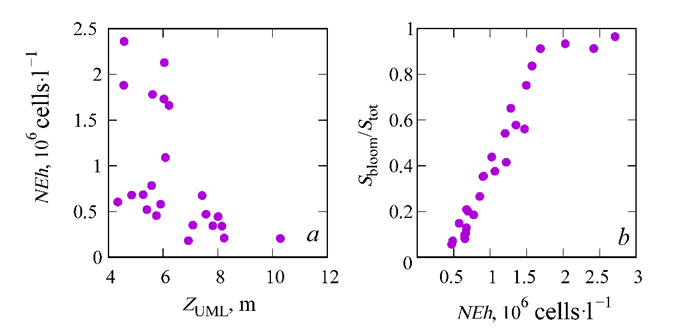
F i g. 6. Relationship between the upper mixed layer thickness (ZUML) in June and the G. huxleyi cell abundance (NEh) in the western deep part (sub-region 1) (a), and between (NEh) in the deep part of the sea (sub-region 1 and 2) and “bloom” area to the total sea area ratio (Sbloom/Stot) (b)
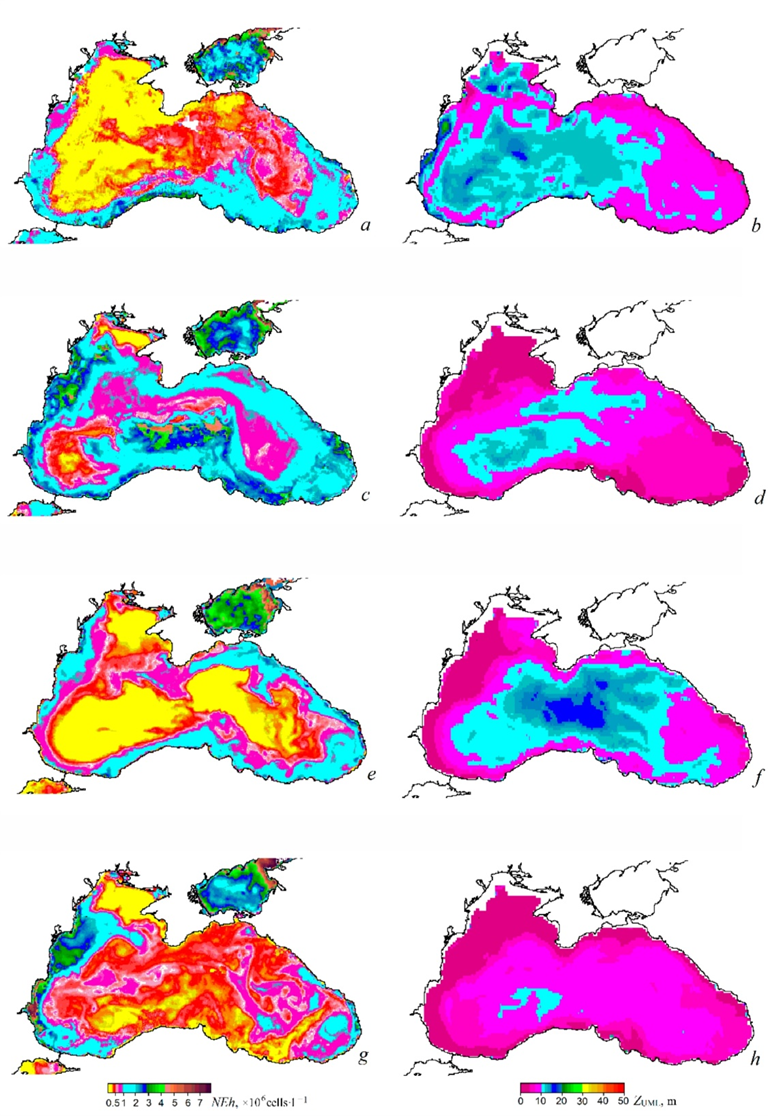
F i g. 7. Maps of G. huxleyi cell abundance (NEh) (a, c, e, g) and upper mixed layer thickness (ZUML) (b, d, f, h) at the onset of “bloom” in the second half of May, 1998 (a, b), 2002 (c, d), 2004 (e, f), 2008 (g, h) (data on ZUML are from [32])
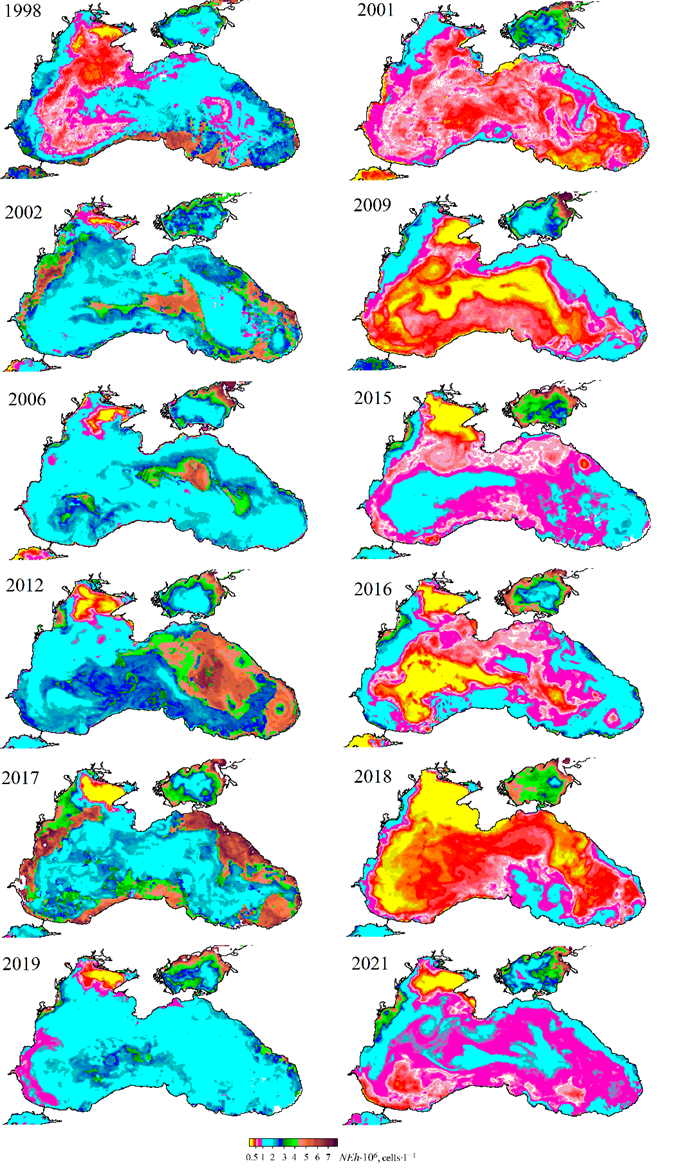
F i g. 8. Maps of spatial distribution of G. huxleyi cell concentration (NEh) in the Black Sea surface layer: in the first half of June in 1998, 2002, 2005, 2006, 2012, 2017 (left), 2001, 2009, 2011, 2015, 2016, 2018, 2021 (right)
The bbp(555) maximum, which is regularly observed in all the sea regions at the beginning of summer, is associated with the G. huxleyi “bloom”, as confirmed by field observations. The G. huxleyi cell abundance (N, million cells×l−1) can be estimated with a high accuracy based on the relationship between the bbp(555) values, m−1, retrieved based on satellite data, and the number of coccolithophore cells determined directly in seawater samples [31]:

A thorough analysis of the interannual variability of NEh and ZUML, calculated bbased on normalized anomaly values, reveals that the extremes of these two curves are in antiphase in the majority of cases (Fig. 5). A comparison of the mean of NEh and ZUML for June, obtained in different years, indicates an inverse relationship between these parameters, which is most pronounced at NEh values less than 1 (Fig. 6).
The maps of NEh distribution at the end of May, when the “bloom” begins, demonstrate a concurrence between areas of higher coccolithophore abundance and those of a thinner upper mixed layer (Fig. 7). This feature of NEh distribution may indicate the ZUML effect on the G. huxleyi “bloom” start. In 1998, 2002, 2006, 2012, 2017 and 2019, when a relatively narrow upper mixed layer was observed in June, a more intense G. huxleyi “bloom” was documented: NEh values exceeded 2 million cells×l−1, reaching 6 million cells×l−1 in some years. On the contrary, in 2001, 2009, 2015, 2016, 2018 and 2021, when the upper mixed layer was more profound, the abundance of coccolithophores was lower (NEh less than 1.2 million cells×l−1) (Fig. 8). Furthermore, an assessment of the interannual variability of the G. huxleyi “bloom” area from 1998 to 2022 demonstrated that the largest areas, accounting for over 80% of the sea surface, were recorded in 2002, 2006, 2012, 2017 and 2019 (Fig. 9). Moreover, the “bloom” area in particular years was directly proportional to the mean of NEh in the deep-water part of the sea (Fig. 6, b).
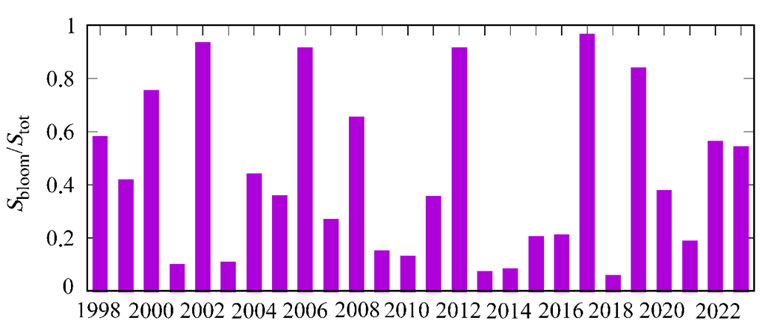
F i g. 9. Interannual variability of G. huxleyi “bloom” area (Sbloom/Stot) in June
On the northwestern shelf (sub-region 4), besides the bbp(555) maximum at the beginning of summer, a marked increase in bbp(555) is evident in December and February. Along the eastern coast (sub-region 11), an increase in bbp(555) (normalized monthly mean anomaly greater than 1) is observed in February (Fig. 3). In these areas, the winter and summer bbp(555) maxima are statistically significant, since the normalized monthly mean anomaly is equal to 1 or greater. In contrast to the summer bbp(555) maximum, which coincides with the annual the annual minimum chlorophyll a concentration, the winter bbp(555) maximum is observed during a period of elevated Ca values.
Discussion
Analysis of time series of normalized monthly mean anomalies in the abundance of G. huxleyi cells revealed that in all the Black Sea sub-regions, the “bloom” occurs regularly in early June (Fig. 3). Across the sea, with the exception of specific areas of the northwestern shelf (4, 5, and 6, a), the G. huxleyi “bloom” is observed when the concentration of chlorophyll a is minimal in the annual cycle (Fig. 3) and the species structure of phytoplankton changes significantly [20, 21]. Such changes in phytoplankton are caused by a pronounced increase in the abundance of a particular species compared to others [11]. The increase in abundance is determined by the excess of the algae growth rate over the rate of cell loss, associated with mortality and consumption by zooplankton [14, 16, 35, 36]. Therefore, the increase in the G. huxleyi contribution to the phytoplankton biomass may be resulted from relatively high (in comparison with other species) growth rate and/or less intensive grazing.
The growth rate of planktonic algae is regulated by a complex of factors, including light, temperature, and the nutrient availability [37, 38]. Of these factors, light has the greatest effect on changes in the phytoplankton growth [39]. The strategy of microalgae adaptation to light is aimed at maintaining a constant growth rate within a wide range of light intensities in the environment [40]. The light intensity saturating the growth rate of diatoms and dinoflagellates is 50–80 μE×m−2×s−1 [40]. In earlier studies, it was observed that the G. huxleyi growth rate reached a state of saturation at a light intensity of 100–200 μE×m−2×s−1 [41, 42]. In subsequent studies [43], light saturation of the growth rate was observed at 65 μE×m−2×s−1, which corresponds to the values characteristic of dinoflagellates and diatoms [40]. A constant growth rate (the so-called plateau of light curve) is observed up to ~ 800 μE μE×m−2×s−1. Light of higher intensity inhibits the growth of microalgae of different taxonomic groups [44]. However, for G. huxleyi this “plateau” extends up to 1200 μE×m−2×s−1 [43, 45].
The inhibition of cell growth rate is caused by destruction of photosystem reaction centers in cells, namely, D1 protein damage in the photosystem II reaction center [46]. A detailed study of the pigment complex structure and the functional characteristics of G. huxleyi demonstrated that high light intensity does not inhibit growth due to the active photoprotective function of the pigment-protein complex. Photoprotective pigments protect cells from extremely high light intensityby minimizing the accumulation of reactive oxygen species and preventing oxidative damage [9], which increases the resistance of photosystem II reaction centers to high-intensity light [43]. Furthermore, coccoliths covering the G. huxleyi cell provide more efficient light scattering compared to other types of microalgae (bbp differs by almost an order of magnitude) [23], which additionally protects the photosynthetic apparatus of coccolithophores [2].
The June G. huxleyi “bloom” period in the Black Sea is characterized by the highest levels of the sea surface insolation (50 ± 4.3 E×m−2×day−1) of during the annual cycle [47, 48] and the thinnest upper mixed layer (Fig. 3), associated with the beginning of a seasonal water stratification [21, 33, 49]. The temperature stratification of surface waters was observed at the beginning of summer during the G. huxleyi “bloom” in various sub-regions of the World Ocean [50–53], while the light intensity within the upper mixed layer was extremly high levels of within the annual cycle (approximately 1000 μE×m−2×s−1) [1, 21, 53–57].
In such conditions, the morphological features and stability of the photosynthetic apparatus of coccolithophores provide them with an advantage in terms of growth rate over other planktonic algae. As a result, an increase in the number of coccolithophores leads to the development of a “bloom”. At its peak, the phytoplankton biomass in the Black Sea can be represented mainly (up to ~ 80%) by one species – G. huxleyi [20, 21].
The maximum growth rate of algae (the plateau on the light curve) was shown to decrease under nutrient limitation [37, 58–60]. The seasonal water stratification results in limited nutrient supply to the upper mixed layer from the nutrient-rich lower layers of water. This results in reduced nutrient availability to phytoplankton in surface waters [5]. Numerous studies demonstrate that at low concentrations of inorganic nitrogen and phosphorus compounds, G. huxleyi grows at higher rate compared to other microalgae taxa. Furthermore, the competitive advantages of G. huxleyi growth under phosphorus deficiency are manifested to a greater extent than under nitrogen deficiency [44, 61–63]. This may provide additional advantages for the G. huxleyi growth in the Black Sea at the beginning of summer. During the formation of seasonal stratification of surface waters due to depletion of nutrients in the cold intermediate layer as a result of winter convection, their upward flow into the euphotic zone is sharply reduced [64]. The plankton community undergoes a transition from external sources of nutrients to internal ones [65]. Here, an imbalance between the influx and consumption of inorganic phosphorus in the euphotic zone is more pronounced than that for nitrogen compounds [66]. As a result, G. huxleyi has additional advantages for growth compared to algae of other taxonomic groups.
It is assumed that certain coccolithophores may adopt a mixotrophic or phagocytic lifestyle, as evidenced by their occurrence below the euphotic zone [67]. Experimental studies on algae cultures have demonstrated that mixotrophy is a survival strategy for coccolithophore at light intensities below the compensation point (light intensity where the photosynthesis rate is equal to the respiration rate) due to the use of organic compounds as energy and/or carbon sources [68]. At the same time, in the surface layer with high light intensity, G. huxleyi coccolithophores are evidently typical autotrophs.
The calcareous shell weakly protects coccolithophores from grazing by both micro- and mesozooplankton. [69]. However, the level of phytoplankton grazing is likely to decrease with an increase in the proportion of coccolithophores in the community. Studies in the Black Sea have shown that the proportion of coccolithophores in the copepod diet is negligible. However, G. huxleyi may form the basis for the nutrition of filter feeders Oikopleura dioica and the heterotrophic dinoflagellate Noctiluca [70]. Consequently, an increase in the proportion of coccolithophores in phytoplankton may result in a decrease of its grazing by mesozooplankton, particularly if the latter is dominated by crustacean.
As a consequence, the increase in G. huxleyi biomass may lead to an increase in the abundance of filter feeder species. At the same time, in most part of the Black Sea, there is a decrease in mesozooplankton biomass from May to June, which is observed simultaneously with changes in community structure. Cold-water crustaceans dominate in March – April, while warm-water species begin their intensive growth in June [71, 72]. Therefore, a decline in the grazing pressure exerted by forage zooplankton at the beginning of summer can stimulate an increase in the phytoplankton biomass at that time.
Microzooplankton can also affect the abundance of G. huxleyi cells [73]. A number of studies indicate that dinoflagellates are a higher priority food source for protozoa compared to coccolithophores [74–76]. Therefore, it is possible to allow some reduction in grazing pressure from the side of microzooplankton, too, under the dominance of G. huxleyi. The combined effect of these factors can result in a consistent increase in the G. huxleyi abundance during the early summer in the majority of sub-regions of the Black Sea.
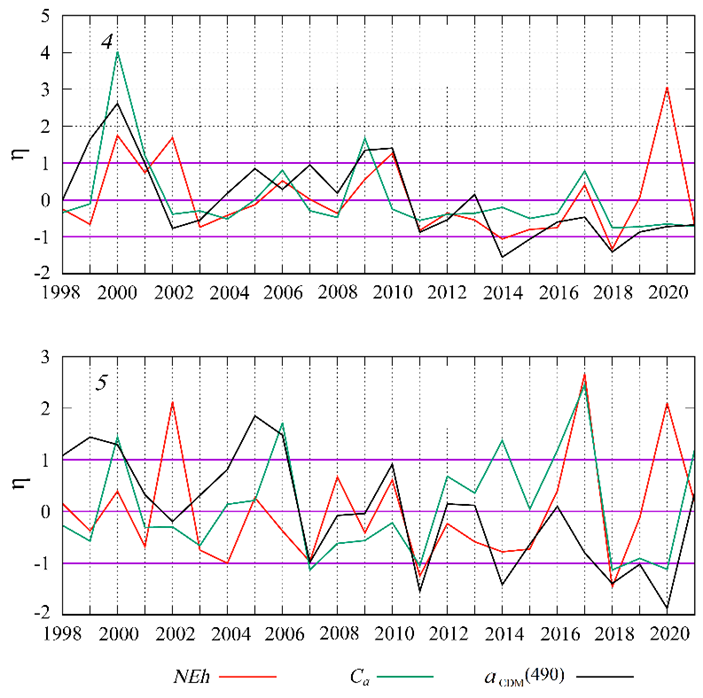
F i g. 10. Interannual variability of normalized monthly mean anomalies of G. huxleyi “bloom” intensity (NEh), chlorophyll a concentration (Ca) and light absorption coefficient by colored detrital matter ( ) in June in sub-regions 4 and 5 in the Black Sea
In coastal waters influenced by the Danube, Dnieper and Dniester runoff (sub-region 4, 5, 6a), the summer bbp(555) maximum is observed in conjunction with an increase in phytoplankton biomass (Fig. 3). The interannual variability of Ca, which is considered a marker of phytoplankton biomass in these waters, shows a close correlation with (Fig. 10).
It should be noted that the value in estuarine areas is mainly determined by the amount of suspended and dissolved substances entering with river runoff [77]. In addition, river waters carry nutrients required for phytoplankton growth [78], therefore, variability of the river runoff intensity during the flood period determines the interannual variability of Ca (phytoplankton biomass) at the beginning of summer (Fig. 10).
The observed increase in bbp(555) during this time is primarily associated with an increase in the content of coccolithophores and coccoliths. This is because organic suspended matter, including other types of phytoplankton, has an order of magnitude lower bbp(555) values [23]. The influence of non-algal particles on the bbp(555) was minimized by excluding from the analysis a 2-kilometer zone of coastal waters, where most mineral particles brought in with river runoff are deposited.
It should be noted that interannual variability in the normalized anomalies of bbp(555) in these sub-regions was inverse to variability of the Ca and  anomalies (Fig. 10). Based on such dynamics, it can be assumed that, the relatively low level of river runoff and, accordingly, a lower input of nutrients create favorable conditions for the competitive growth of coccolithophores, which are able to maintain higher growth rates under conditions of low nutrient supply compared to other species, especially diatoms [1, 13].
In the shallow northwestern shelf (sub-region 4), high anomalies in the seasonal variation of bbp(555) are observed not only in June, but also in the winter months (Fig. 3). A comparison of the interannual variability of February values of the bbp(555) and Ca anomalies (Fig. 4) demonstrates that in most cases the extremes of these two curves are in antiphase. This suggests that the increase in the abundanceof coccolithophore on the northwestern shelf occurs concurrently with a decline in the total phytoplankton biomass, which is associated with the deceasing of the growth of a typical winter phytoplankton complex dominated by by the diatoms.
Regular monitoring in 1998–2000 allowed for the comparison of the intra-annual dynamics of the phytoplankton structure in the western deep-sea in years with cold and warm winters [20]. In the cold winter of 1998, phytoplankton was represented by a complex of diatom species, and a sharp increase of phytoplankton biomass was observed in early March caused by an intense ”bloom” of Proboscia alata.
During the relatively warm winter of 1999, a significant number of the G. huxleyi coccolithophores were observed. Its contribution to the total phytoplankton biomass in the central western deep-water part and in the continental slope area reached 40–70% [20]. No spring “bloom” of diatoms was observed after the warm winter [20]. The elevated abundance of G. huxleyi in the phytoplankton during this period can be explained by the higher stability of the water column. leads to a decrease in upward inorganic nutrient fluxes, which are the main source for phytoplankton growth in the euphotic zone during the cold period [64, 65]. The decrease in the availability of dissolved inorganic nitrogen and phosphorus gives G. huxleyi an advantage, allowing it to achieve higher growth rates compared to diatoms in low nutrient environments [1, 79–81]. In combination with favorable light conditions due to weak vertical mixing of waters, this leads to an increase in G. huxleyi abundance in warm winters. Conversely, during cold winters, active mixing of waters significantly worsens light conditions in the photosynthesis zone. However, mixing intensifies the upward nutrient fluxes into the euphotic zone, thereby creating favorable conditions for the diatoms growth. This is due to the fact that the level of light saturation of growth for diatoms is significantly lower compared to coccolithophores [3, 22, 82].
The development of G. huxleyi in different seasons reflects its genetic and physiological plasticity [1]. Molecular genetic studies have revealed the presence of at least two distinct groups within G. huxleyi, distinguished by variations in the mitochondrial genome sequences. These groups exhibit different temperature preferences, with the cold-water group inhabiting the subarctic waters of the North Atlantic and Pacific Oceans, and the warm-water group occupying the subtropical waters of the Atlantic and Pacific Oceans, as well as the Mediterranean Sea [81]. The relationship between specific genetic strains of G. huxleyi and the physical and chemical conditions of their habitats is illustrated through the analysis of data from various sub-regions of the World Ocean [83]. Intraspecific genetic variability can be traced observed not only between strains of G. huxleyi from different sub-regions, but also within the boundaries of a single “bloom”. This variability is associated with key physiological processes in cells, such as rates of calcification, photosynthesis, sulfur and lipids biochemical transformation, nitrogen and phosphorus assimilation, which ultimately affect the entire ecosystem [84]. Therefore, targeted genetic studies of the Black Sea population of G. huxleyi are essential to identify patterns in the dynamics of “bloom” of this species or a complex of related species.
Conclusions
Based on satellite data and regional algorithms, the values of chlorophyll a concentration, the particulate backscattering coefficient and the absorption coefficient of light by colored detrital matter, were retrieved with two-week averaging for various sub-regions of the Black Sea from 1998 to 2023.
The analysis of the normalized monthly mean anomalies’ variability allows us to reveal annual cycles of these parameters, to determine the general patterns and features of their dynamics in particular sea sub-regions. It was demonstrated that in early June, coccolithophores “bloom” with interannual variations in its intensity and area is regularly observed in all sub-regions. The G. huxleyi “bloom” is observed annually at the beginning of summer in many regions of the World Ocean under at least one general condition – the highest light intensity within the upper mixed layer (about 1000 μEm−2×s−1). This is evidently a key factor in the changing the phytoplankton species structure, leading to the dominance of coccolithophores (particularly G. huxleyi). The G. huxleyi dominates due to its physiologically determined capacity to grow without inhibition under extremely high light intensities, which inhibit the growth of most other algae.
It has been demonstrated that in the majority of sub-regions in the Black Sea, during the G. huxleyi “bloom” in early summer, the algae species are replaced by G. huxleyi, which is not accompanied by an increase in phytoplankton biomass (using the concentration of photosynthetically active pigment as a biomass marker).
In coastal waters influenced by river runoff, G. huxleyi abundance and phytoplankton biomass increase. Level of river runoff was shown to influence the increase in phytoplankton biomass in spring in these Black Sea sub-regions. Higher abundance of coccolithophores was observed while the chlorophyll a concentration decreased. In addition, increase in the number of coccolithophores in the Black Sea has been observed in the cold period; however, the intensity and time scale of such processes vary significantly across the water area in different years. Consequently, no significant increase in normalized anomalies of particle backscattering coefficients in the cold period is observed in most sub-regions.
However, a notable and relatively consistent increase in this indicator is observed during the cold period (December – February) on the northwestern shelf. Significant increase in the number of G. huxleyi is evident, despite a decline in the total phytoplankton biomass. Significant increase in the number of G. huxleyi is observed, while the phytoplankton biomass decreases.
It is evident that the primary factor contributing to abundance of G. huxleyi in the Black Sea throughout the year is the capacity of coccolithophores to maintain elevated growth rates in low-nutrient environments. Consequently, the proportion of G. huxleyi in the phytoplankton exhibits a periodic increase in different sub-regions, coinciding with nutrients depletion. This is particularly evident in instances of decreased nutrient flow, resulting from increased water column stability and/or reduced coastal runoff levels. However, at the beginning of summer, the key factor determining the regular “bloom” of G. huxleyi throughout the Black Sea and other World Ocean sub-regions is the capacity of coccolithophores to maintain maximum growth at a wide range of light intensity, extending to extremely high intensity, inhibiting the growth of all other groups of microalgae.
1. Iglesias-Rodríguez, M.D., Brown, C.W., Doney, S.C., Kleypas, J., Kolber, D., Kolber, Z., Hayes, P.K. and Falkowski, P.G., 2002. Representing Key Phytoplankton Functional Groups in Ocean Carbon Cycle Models: Coccolithophorids. Global Biogeochemical Cycles, 16(4), 1100. https://doi.org/10.1029/2001GB001454
2. Balch, W.M., 2018. The Ecology, Biogeochemistry, and Optical Properties of Coccolithophores. Annual Review of Marine Science, 3(10), pp. 71-98. https://doi.org/10.1146/annurev-marine-121916-063319
3. Balch, W.M., Holligan, P.M. and Kilpatrick, K.A., 1992. Calcification, Photosynthesis and Growth of the Bloom-Forming Coccolithophore, Emiliania Huxleyi. Continental Shelf Research, 12(12), pp. 1353-1374. https://doi.org/10.1016/0278-4343(92)90059-s
4. Poulton, A.J., Adey, T.R., Balch, W.M. and Holligan, P.M., 2007. Relating Coccolithophore Calcification Rates to Phytoplankton Community Dynamics: Regional Differences and Implications for Carbon Export. Deep Sea Research Part II: Topical Studies in Oceanography, 54(5-7), pp. 538-557. https://doi.org/10.1016/j.dsr2.2006.12.003
5. Krumhardt, K.M., Lovenduski, N.S., Iglesias-Rodríguez, M.D. and Kleypas, J.A., 2017. Coccolithophore Growth and Calcification in a Changing Ocean. Progress in Oceanography, 159(23), pp. 276-295. https://doi.org/10.1016/j.pocean.2017.10.007
6. Krumhardt, K.M., Lovenduski, N.S., Long, M.C., Levy, M., Lindsay, K., Moore, J.K. and Nissen, C., 2019. Coccolithophore Growth and Calcification in an Acidified Ocean: Insights from Community Earth System Model Simulations Ocean. Journal of Advances in Modeling Earth Systems, 11(5), pp. 1418-1437. https://doi.org/10.1029/2018MS001483
7. Krumhardt, K.M., Lovenduski, N.S., Freeman, N.M. and Bates, N.R., 2016. Apparent Increase in Coccolithophore Abundance in the Subtropical North Atlantic from 1990 to 2014. Biogeosciences, 13(4), pp. 1163-1177. https://doi.org/10.5194/bg-13-1163-2016
8. Winter, A., Henderiks, J., Beaufort, L., Rickaby, R.E.M. and Brown, C.W., 2014. Poleward Expansion of the Coccolithophore Emiliania Huxleyi. Journal of Plankton Research, 36(2), pp. 316-325. https://doi.org/10.1093/plankt/fbt110
9. Read, B.A., Kegel, J., Klute, M.J., Kuo, A., Lefebvre, S.C., Maumus, F., Mayer, C., Miller, J., Monier, A. [et al.], 2013. Pan Genome of the Phytoplankton Emiliania Underpins Its Global Distribution. Nature, 499, pp. 209-213. https://doi.org/10.1038/nature12221
10. Kiørboe, T., Hansen, J.L.S., Alldredge, A.L., Jackson, G.A., Passow, U., Dam, H.G., Drapeau, D.T., Waite, A. and Garcia, C.M., 1996. Sedimentation of Phytoplankton during a Diatom Bloom: Rates and Mechanisms. Journal of Marine Research, 54(6), pp. 1123-1148. https://doi.org/10.1357/0022240963213754
11. Smayda, T.J., 1997. What is a Bloom? A Commentary. Limnology and Oceanography, 42(5), pp. 1132-1136. https://doi.org/10.4319/lo.1997.42.5_part_2.1132
12. Lassus, P., 2016. Toxic and Harmful Microalgae of the World Ocean. Nantes: International Society for the Study of Harmful Algae/Intergovernmental Oceanographic Commission of UNESCO, 523 p.
13. Makareviciute-Fichtner, K., Matthiessen, B., Lotze, H.K. and Sommer, U., 2024. Nutrient Enrichment Alters Phytoplankton Biomass and Composition via Silicon Limitation. Frontiers in Marine Science, 11, 1289768. https://doi.org/10.3389/fmars.2024.1289768
14. Richardson, K., 1997. Harmful or Exceptional Phytoplankton Blooms in the Marine Ecosystem. Advances in Marine Biology, 31, pp. 301-385. https://doi.org/10.1016/S0065-2881(08)60225-4
15. Kahru, M. and Nommann, S., 1990. The Phytoplankton Spring Bloom in the Baltic Sea in 1985, 1986: Multitude of Spatiotemporal Scales. Continental Shelf Research, 10(4), pp. 329-354. https://doi.org/10.1016/0278-4343(90)90055-Q
16. Carstensen, J., Henriksen, P. and Heiskanen, A.-S., 2007. Summer Algal Blooms in Shallow Estuaries: Definition, Mechanisms, and Link to Eutrophication. Limnology and Oceanography, 52(1), pp. 370-384. https://doi.org/10.4319/lo.2007.52.1.0370
17. Paerl, H.W., 1988. Nuisance Phytoplankton Blooms in Coastal, Estuarine and Inland Waters. Limnology and Oceanography, 33(4), part 2, pp. 823-843. https://doi.org/10.4319/lo.1988.33.4part2.0823
18. Margalef, R., 1978. Life-Forms of Phytoplankton as Survival Alternatives in an Unstable Environment. Oceanologica Acta, 1(4), pp. 493-509.
19. Isles, P.D. and Pomati, F., 2021. An Operational Framework for Defining and Forecasting Phytoplankton Blooms. Frontiers in Ecology and the Environment, 19(8), pp. 443-450. https://doi.org./10.1002/fee.2376
20. Berseneva, G., Churilova, T. and Georgieva, L., 2004. Seasonal Variability in Pigment Concentration, Taxonomic Structure of Phytoplankton Community in Western Part of the Black Sea. Oceanology, 44(3), pp. 362-371. https://doi.org/10.1594/PANGAEA.762833
21. Pautova, L.A., Mikaelyan, A.S. and Silkin, V.A., 2007. Structure of Plankton Phytocoenoses in the Shelf Waters of the Northeastern Black Sea during the Emiliania Huxleyi Bloom in 2002-2005. Oceanology, 47(3), pp. 408-417. https://doi.org/10.1134/S0001437007030101
22. Moncheva, S., Gotsis-Skretas, O., Pagou, K. and Krastev, A., 2001. Phytoplankton Blooms in Black Sea and Mediterranean Coastal Ecosystems Subjected to Anthropogenic Eutrophication: Similarities and Differences. Estuarine Coastal and Shelf Science, 53(3), pp. 281-295. https://doi.org/10.1006/ecss.2001.0767
23. Stramski, D. and Kiefer, D.A., 1991. Light Scattering by Microorganisms in the Open Ocean. Progress in Oceanography, 28(4), pp. 343-383. https://doi.org/10.1016/0079-6611(91)90032-h
24. Cokacar, T., Oguz, T. and Kubilay, N., 2004. Satellite-Detected Early Summer Coccolithophore Blooms and Their Interannual Variability in the Black Sea. Deep Sea Research Part I: Oceanographic Research Papers, 51(8), pp. 1017-1031. https://doi.org/10.1016/j.dsr.2004.03.007
25. Kopelevich, O., Burenkov, V., Sheberstov, S., Vazyulya, S., Kravchishina, M., Pautova, L., Silkin, V., Artemiev, V. and Grigoriev, A., 2014. Satellite Monitoring of Coccolithophore Blooms in the Black Sea from Ocean Color Data. Remote Sensing of Environment, 146, pp. 113-123. https://doi.org/10.1016/j.rse.2013.09.009
26. Kubryakov, A.A., Mikaelyan, A.S. and Stanichny, S.V., 2019. Summer and Winter Coccolithophore Blooms in the Black Sea and Their Impact on Production of Dissolved Organic Matter from Bio-Argo Data. Journal of Marine Systems, 199, 103220. https://doi.org/10.1016/j.jmarsys.2019.103220
27. Vazyulya, S., Deryagin, D., Glukhovets, D., Silkin, V. and Pautova, L., 2023. Regional Algorithm for Estimating High Coccolithophore Concentration in the Northeastern Part of the Black Sea. Remote Sensing, 15(9), 2219. https://doi.org/10.3390/rs15092219
28. Cazzaniga, I., Zibordi, G. and Mélin, F., 2021. Spectral Variations of the Remote Sensing Reflectance during Coccolithophore Blooms in the Western Black Sea. Remote Sensing of Environment, 264, 112607. https://doi.org/10.1016/j.rse.2021.112607
29. Suslin, V., Pryahina, S., Churilova, T. and Slabakova, V., 2016. The Black Sea IOPs Based on SeaWiFS Data. In: G. G. Matvienko and O. A. Romanovskii, eds., 2016. Proceedings of SPIE – the International Society for Optical Engineering. XXII International Symposium on Atmospheric and Ocean Optics: Atmospheric Physics. Tomsk: SPIE. Vol. 10035, 1003531. https://doi.org/10.1117/12.2248332
30. Suslin, V. and Churilova, T., 2016. A Regional Algorithm for Separating Light Absorption by Chlorophyll-a and Coloured Detrital Matter in the Black Sea, Using 480–560 nm Bands from Ocean Colour Scanners. International Journal of Remote Sensing, 37(18), pp. 4380-4400. https://doi.org/10.1080/01431161.216.1211350
31. Churilova, T.Ya. and Suslin, V.V., 2012. On Causes of Emiliania Huxleyi Domination in Phytoplankton of Deep Waters Part of the Black Sea in Early Summer. In: MHI, 2012. Ecological Safety of Coastal and Shelf Zones and Comprehensive Use of Shelf Resources. Sevastopol: ECOSI-Gidrofizika. Iss. 26, vol. 2, pp. 195-203 (in Russian).
32. Dorofeev, V.L., 2009. Modeling of Decadal Variations in the Black-Sea Ecosystem. Physical Oceanography, 19(6), pp. 400-409. https://doi.org/10.1007/s11110-010-9062-6
33. Ivanov, V.A. and Belokopytov, V.N., 2013. Oceanography of the Black Sea. Sevastopol: MHI, 210 p.
34. Suslin, V.V. and Churilova, T.Ya., 2010. Simplified Method of Calculation of Spectral Diffuse Beam Attenuation Coefficient in the Black Sea Upper Layer on the Basis of Satellite Data. In: MHI, 2010. Ecological Safety of Coastal and Shelf Zones and Comprehensive Use of Shelf Resources. Sevastopol: ECOSI-Gidrofizika. Iss. 22, pp. 47-60 (in Russian).
35. Behrenfeld, M.J., 2010. Abandoning Sverdrup's Critical Depth Hypothesis on Phytoplankton Blooms. Ecology, 91(4), pp. 977-989. https://doi.org/10.1890/09-1207.1
36. González-Gil, R., Banas, N.S., Bresnan, E. and Heath, M.R., 2022. The Onset of the Spring Phytoplankton Bloom in the Coastal North Sea Supports the Disturbance Recovery Hypothesis. Biogeosciences, 19(9), pp. 2417-2426. https://doi.org/10.5194/bg-19-2417-2022
37. MacIntyre, H.L., Kana, T.M., Anning, T. and Geider, R.J., 2002. Photoacclimation of Photosynthesis Irradiance Response Curves and Photosynthetic Pigments in Microalgae and Cyanobacteria. Journal of Phycology, 38(1), pp. 17-38. https://doi.org/10.1046/j.1529-8817.2002.00094.x
38. Falkowski, P.G., Woodhead, A.D. and Vivirito, K., eds., 1992. Primary Productivity and Biogeochemical Cycles in the Sea. New York: Springer, 550 p. https://doi.org/10.1007/978-1-4899-0762-2
39. Falkowski, P.G. and Raven, J.A., 2007. Aquatic Photosynthesis. New Jersey: Princeton University Press, 488 p. https://doi.org/10.1515/9781400849727
40. Richardson, K., Beardall, J. and Raven, J.A., 1983. Adaptation of Unicellular Algae to Irradiance: An Analysis of Strategies. New Phytologist, 93, pp. 157-191. https://doi.org/10.1111/J.1469-8137.1983.TB03422.X
41. Van Bleijswijk, J.D.L., Kempers, R.S., Veldhuis, M.J. and Westbroek, P., 1994. Cell and Growth Characteristics of Types A and B of Emiliania Huxleyi (Prymnesiophyceae) as Determined by Flow Cytometry and Chemical Analyses. Journal of Phycology, 30(2), pp. 230-241. https://doi.org/10.1111/j.0022-3646.1994.00230.x
42. Nielsen, M.V., 1997. Growth, Dark Respiration and Photosynthetic Parameters of the Coccolithophorid Emiliania Huxleyi (Prymnesiophyceae) Acclimated to Different Day Length-Irradiance Combinations. Journal of Phycology, 33(5), pp. 818-822. https://doi.org/10.1111/j.0022-3646.1997.00818.x
43. McKew, B.A., Davey, P., Finch, S.J., Hopkins, J., Lefebvre, S.C., Metodiev, M.V., Oxborough, K., Raines, C.A., Lawson, T. [et al.], 2013. The Trade‐off between the Light‐Harvesting and Photoprotective Functions of Fucoxanthin‐Chlorophyll Proteins Dominates Light Acclimation in Emiliania Huxleyi (Clone CCMP 1516). New Phytologist, 200(1), pp. 74-85. https://doi.org/10.1111/nph.12373
44. Paasche, E., 2002. A Review of the Coccolithophorid Emilinia Huxleyi (Prymnesiophyceae) with Particular Reference to Growth, Coccolith Formation, and Calcification–Photosynthesis Interactions. Phycologia, 40(6), pp. 503-529. https://doi.org/10.2216/i0031-8884-40-6-503.1
45. Gafar, N.A. and Schulz, K.G., 2018. A Three-Dimensional Niche Comparison of Emiliania Huxleyi and Gephyrocapsa Oceanica: Reconciling Observations with Projections. Biogeosciences, 15(11), pp. 3541-3560. https://doi.org/10.5194/bg-15-3541-2018
46. Raven, J.A., 2011. The Cost of Photoinhibition. Physiologia Plantarum, 142(1), pp. 87-104. https://doi org/10.1111/j.1399-3054.2011.01465.x
47. Neumann, G. and Pierson, W.J., 1966. Principles of Physical Oceanography. Englewood Cliffs: Prentice-Hall, pp. 230-233.
48. Suslin, V.V., Korolev, S.N., Kucheryaviy, A.A., Churilova, T.Ya. and Krivenko, O.V., 2015. Photosynthetically Available Radiation on Surface of the Black Sea Based on Ocean Color Data. In: O. A. Romanovskii, ed., 2015. Proceedings of SPIE. 21st International Symposium Atmospheric and Ocean Optics: Atmospheric Physics. Tomsk: SPIE. Vol. 9680, 96800T. https://doi.org/10.1117/12.2203660
49. Churilova, T.Ya., Skorokhod, E.Yu., Efimova, T.V. and Moiseeva, N.A., 2025. Chlorophyll “a” Concentration and Light Absorption by Coloured Dissolved Organic Matter in the Black Sea in Winter (2018) and Summer (2020). Fundamental and Applied Hydrophysics, (1) (being printed) (in Russian).
50. Napp, J.M. and Hunt, G.L.J., 2001. Anomalous Conditions in the South-Eastern Bering Sea 1997: Linkages among Climate, Weather, Ocean and Biology. Fish Oceanography, 10(1), pp. 61-68. https://doi.org/10.1046/j.1365-2419.2001.00155.x
51. Mohan, R., Mergulhao, L.P., Guptha, M.V.S., Rajakumar, A., Thaban, M., AnilKumar, N., Sudhakar, M. and Ravindra, R., 2008. Ecology of Coccolithophores in the Indian Sector of the Southern Ocean. Marine Micropaleontology, 67(1-2), pp. 30-45. https://doi.org/10.1016/j.marmicro.2007.08.005
52. Beaufort, L., Couapel, M., Buchet, N., Claustre, H. and Goyet, G., 2008. Calcite Production by Coccolithophores in the South East Pacific Ocean. Biogeosciences, 5(4), pp. 1101-1117. https://doi.org/10.5194/bg-5-1101-2008
53. O’Brien, C.J., Vogt, M. and Gruber, N., 2016. Global Coccolithophore Diversity: Drivers and Future Change. Progress in Oceanography, 140, pp. 27-42. https://doi.org/10.1016/j.pocean.2015.10.003
54. Oguz, T. and Merico, A., 2006. Factors Controlling the Summer Emiliania Huxleyi Bloom in the Black Sea: A Modeling Study. Journal of Marine Systems, 59(3-4), pp. 173-188. https://doi.org/10.1016/j.jmarsys.2005.08.002
55. Nanninga, H. and Tyrrell, T., 1996. Importance of Light for the Formation of Algal Blooms by Emiliania Huxleyi. Marine Ecology Progress Series, 136, pp. 195-203. https://doi.org/10.3354/meps136195
56. Karabashev, G.S., Sheberstov, S.V. and Yakubenko, V.G., 2006. The June Maximum of Normalized Radiance and Its Relation to the Hydrological Conditions and Coccolithophorid Bloom in the Black Sea. Oceanology, 46(3), pp. 305-317. https://doi.org/10.1134/S0001437006030027
57. Mikaelyan, A.S., Pautova, L.A., Pogosyan, S.I. and Sukhanova, I.N., 2005. Summer Blooming of Coccolithophorids in the Northeastern Black Sea. Oceanology, 45(suppl. 1), pp. S127-S138.
58. Geider, R.J., Macintyre, H.L. and Kana, T., 1997. Dynamic Model of Phytoplankton Growth and Acclimation: Responses of the Balanced Growth Rate and the Chlorophyll a: Carbon Ratio to Light, Nutrient-Limitation and Temperature. Marine Ecology Progress Series, 148(1-3), pp. 187-200. https://doi.org/10.3354/meps148187
59. Moore, C.M., Mills, M.M., Milne, A., Langlois, R., Achterberg, E.P., Lochte, K., Geider, R.J. and La Roche, J., 2006. Iron Limits Primary Productivity during Spring Bloom Development in the Central North Atlantic. Global Change Biology, 12(4), pp. 626-634. https://doi.org/10.1111/j.1365-2486.2006.01122.x
60. Cullen, J.J., Yang, X. and MacIntyre, H.L., 1992. Nutrient Limitation of Marine Photosynthesis. In: P. G. Falkowski and A. V. Woodhead, eds., 1992. Primary Productivity and Biogeochemical Cycles in the Sea. New York: Plenum Press, pp. 69-88. https://doi.org /10.1007/978-1-4899-0762-2_5
61. Reigman, R., Noordeloos, A.A.M. and Cadee, G.C., 1992. Phaeocystis Blooms and Eutrophication of the Continental Coastal Zones of the North Sea. Marine Biology, 112(3), pp. 479-484. https://doi.org/10.1007/BF00356293
62. Egge, J.K. and Heimdal, B.R., 1994. Blooms of Phytoplankton Including Emiliania Huxleyi (Haptophyta). Effects of Nutrient Supply in Different N:P Ratios. Sarsia, 79(4), pp. 333-348. https://doi.org/10.1080/00364827.1994.10413565
63. Tyrrell, T. and Taylor, A.H., 1996. A Modelling Study of Emiliania Huxleyi in the NE Atlantic. Journal of Marine Systems, 9(1-2), pp. 83-112. https://doi.org/10.1016/0924-7963(96)00019-x
64. Krivenko, O.V., 2008. Contents and Uptake of Inorganic Nitrogen in the Black Sea. Marine Ecological Journal, 7(4), pp. 13-26 (in Russian).
65. Krivenko, O.V., 2006. Basic Regularities of the Formation of “New” and Regeneration Production in the Black Sea. Physical Oceanography, 16, pp. 337-349. https://doi.org/10.1007/s11110-006-0037-6
66. Krivenko, O.V. and Parkhomenko, A.V., 2015. Upward and Regeneration Fluxes of Inorganic Nitrogen and Phosphorus of the Deep-Water Areas of the Black Sea. Biology Bulletin Reviews, 5(3), pp. 268-281.
67. Poulton, A.J., Holligan, P.M., Charalampopoulou, A. and Adey, T.R., 2017. Coccolithophore Ecology in the Tropical and Subtropical Atlantic Ocean: New Perspectives from the Atlantic Meridional Transect (AMT) Programme. Progress in Oceanography, 158, pp. 150-170. https://doi.org/10.1016/j.pocean.2017.01.003
68. Godrijan, J., Drapeau, D.T. and Balch, W.M., 2022. Osmotrophy of Dissolved Organic Carbon by Coccolithophores in Darkness. New Phytologist, 233(2), pp. 781-794. https://doi.org/10.1111/nph.17819
69. Mayers, K.M.J., Poulton, A.J., Bidle, K., Thamatrakoln, K., Schieler, B., Giering, S.L.C., Wells, S.R., Tarran, G.A., Mayor, D. [et al.], 2020. The Possession of Coccoliths Fails to Deter Microzooplankton Grazers. Frontiers in Marine Science, 7, 569896. https://doi.org/10.3389/fmars.2020.569896
70. Amelina, A.B., Sergeeva, V.M., Arashkevich, E.G., Drits, A.V., Solovyev, K.A. and Louppova, N.E., 2017. Feeding of the Dominant Herbivorous Plankton Species in the Black Sea and Their Role in Coccolithophorid Consumption. Oceanology, 57(6), pp. 806-816. https://doi.org/10.1134/S000143701706011X
71. Grese, V.N. and Fedorina, A.I., 1979. Abundance and Biomass of the Zooplankton. In: V.N. Grese, ed., 1979. Fundamentals of Biological Productivity of the Black Sea. Kiev: Naukova Dumka, pp. 143-168 (in Russian).
72. Gubanova, A.D., Polikarpov, I.G., Saburova, M.A. and Prusova, I., 2002. Long-Term Dynamics of Mesozooplankton by the Example of the Copepoda Community in Sevastopol Bay. Oceanology, 42(4), pp. 512-520.
73. Rost, B. and Riebesell, U., 2004. Coccolithophores and the Biological Pump: Responses to Environmental Changes. In: H. R. Thierstein and J. R. Young, eds., 2004. Coccolithophores: From Molecular Processes to Global Impact. Heidelberg; Berlin: Springer, pp. 99-125. https://doi.org/10.1007/978-3-662-06278-4_5
74. Müller, M.N., 2019. On the Genesis and Function of Coccolithophore Calcification. Frontiers in Marine Science, 6, 49. https://doi.org/10.3389/fmars.2019.00049
75. Haunost, M., Riebesell, U., D’Amore, F., Kelting, O. and Bach, L.T., 2021. Influence of the Calcium Carbonate Shell of Coccolithophores on Ingestion and Growth of a Dinoflagellate Predator. Frontiers in Marine Science, 8, 664269. https://doi.org/10.3389/fmars.2021.664269
76. Monteiro, F.M., Bach, L.T., Brownlee, C., Bown, P., Rickaby, R.E.M., Poulton, A.J., Tyrrell, T., Beaufort, L., Dutkiewicz, S. [et al.], 2016. Why Marine Phytoplankton Calcify. Science Advances, 2(7), e1501822. https://doi.org/10.1126/sciadv.1501822
77. Nelson, N.B. and Siegel, D.A., 2013. The Global Distribution and Dynamics of Chromophoric Dissolved Organic Matter. Annual Review of Marine Science, 5(1), pp. 447-476. https://doi.org/10.1146/annurev-marine-120710-100751
78. Oguz, T., ed., 2008. State of the Environment of the Black Sea (2001–2006/7). Istanbul: Commission on the Protection of the Black Sea Against Pollution, 488 p.
79. Tozzi, S., Schofield, O. and Falkowski, P., 2004. Historical Climate Change and Ocean Turbulence as Selective Agents for Two Key Phytoplankton Functional Groups. Marine Ecology Progress Series, 274, pp. 123-132. https://doi.org/10.3354/meps274123
80. Estrada, M., Alcaraz, M. and Marrase, C., 1987. Effects of Turbulence on the Composition of Phytoplankton Assemblages in Marine Microcosms. Marine Ecology Progress Series, 38(3), pp. 267-281. https://doi.org/10.3354/meps038267
81. Falkowski, P., Schofield, O., Katz, M.E., de Schootbrugge, B.V. and Knoll, A.H., 2004. Why is the Land Green and the Ocean Red? In: H. R. Thierstein and J. R. Young, eds., 2004. Coccolithophores: From Molecular Processes to Global Impact. Heidelberg; Berlin: Springer, pp. 429-453. https://doi.org/10.1007/978-3-662-06278-4_16
82. Hagino, K., Bendif, E.M., Young, J.R., Kogame, K., Probert, I., Takano, Y., Horiguchi, T., de Vargas, C. and Okada, H., 2011. New Evidence for Morphological and Genetic Variation in the Cosmopolitan Coccolithophore Emiliania Huxleyi (Prymnesiophyceae) from the Cox1b-Atp4 Genes. Journal of Phycology, 47(5), pp. 1164-1176. https://doi.org/10.1111/j.1529-8817.2011.01053.x
83. Bendif, E.M., Probert, I., Archontikis, O.A., Young, J.R., Beaufort, L., Rickaby, R.E. and Filatov, D., 2023. Rapid Diversification Underlying the Global Dominance of a Cosmopolitan Phytoplankton. ISME Journal, 17(4), pp. 630-640. https://doi.org/10.1038/s41396-023-01365-5
84. Wheeler, G.L., Sturm, D. and Langer, G., 2023. Gephyrocapsa Huxleyi (Emiliania Huxleyi) as a Model System for Coccolithophore Biology. Journal of Phycology, 59(6), pp. 1123-1129. https://doi.org/10.1111/jpy.13404