


Russian Federation
Russian Federation
Russian Federation
Purpose. The study is purposed at analyzing spatial and temporal climatic variability of the upper mixed layer in the Barents and Kara seas on a climatic scale. Methods and Results. Potential water density is calculated based on the ORAS5 reanalysis data on the average monthly values of potential temperature and salinity at the nodes of a grid of about 10 km with an irregular step over vertical up to a depth of about 400 m for the 1958–2022 period. The formed density array makes it possible to determine the upper mixed layer thickness in the Barents and Kara seas. Threshold criterion ∆σ = 0.03 kg/m3 is used for its estimation. The obtained results permit to identify the areas notable for significant variability of the upper mixed layer thickness. Conclusions. The analysis shows that the upper mixed layer maximum development falls on February and March, whereas the minimum one – on June and July. Thus, the highest values of the upper mixed layer thickness are observed in the seas under consideration during increased autumn-winter convection. In the cold half of a year (November – April), the upper mixed layer thickness averages 105 m in the Barents Sea and 23 m in the Kara Sea. The analysis of interannual variability of the average annual thickness values of these layers shows the presence of a positive climatic trend, i. e. a thickness increase in the upper mixed layers in the Barents and Kara seas in 1958–2022. The upward trend is observed both in the cold and warm halves of a year. The values of average annual thickness trends of the upper mixed layers in the Barents and Kara seas average 1.3 m/10 years and 1.2 m/10 years, respectively.
Barents Sea, Kara Sea, upper mixed layer thickness, vertical mixing, linear trend, interannual variability
Introduction
The upper mixed layer (UML) is formed due to thermal and dynamic interaction at the ocean-atmosphere boundary: surface heating, cooling, wind-wave mixing, intra-water exchange, etc. [1]. Its state affects the heat flux from the ocean into the atmosphere through the ice cover and largely determines the thermal balance of the Arctic Ocean surface. The ice cover formation and stability are associated with the UML thickness, thermohaline parameters and characteristics of the underlying halocline [2–5].
A significant reduction of the ice cover area at the beginning of the current century [5–10] resulted in the surface layer becoming more accessible to the direct effect of wind and solar radiation. Such a change in environmental conditions could not but affect thermohaline structure of the surface layer, which has indeed undergone significant changes in recent years. The origin of the Arctic surface layer waters and the variability of its characteristics were considered in a number of works [5, 11–15]. According to modern concepts, the surface layer is formed from river runoff waters, atmospheric precipitation and waters of the Atlantic and Pacific origin [5, 7, 8, 16]. In [13], presence of a decrease in the UML thickness over a 30-year period in six regions of the Arctic was determined based on the analysis of spatial and temporal variability of its characteristics for 1979–2012. In [5], the thickness and salinity of the Arctic Basin UML were calculated for the winter period of 1950–2013 according to an array of oceanographic data. Estimates of the UML thickness spatial distribution in the Kara Sea in August – November 2007 and 2008 obtained from expeditionary data are presented in [14].
The work is purposed at studying the UML thickness spatial and temporal variability in the Barents and Kara seas using the most complete modern climatic oceanographic data array.
Materials and methods
ORAS5 reanalysis arrays of average monthly potential temperature and salinity values at nodes of a grid of about 10 km with a non-uniform depth step of up to about 400 m for 1958–2022 represent the initial hydrological data. Potential density arrays for the Barents and Kara seas were formed on their basis to calculate the UML thickness. The study area is limited by coordinates 65–80°N, 16–102°E.
Three main groups of methods for calculating the UML thickness are as follows: threshold criterion methods, gradient methods and profile curvature analysis methods [13, 17]. In this work, in order to estimate the UML after several test calculations, we adopted a threshold criterion which determines the depth where potential water density is greater than its surface potential density by value ∆σ = 0.03 kg/m3, with
 , (1)
, (1)
 is potential density at given depth
  ,
,  is potential density at the surface [18, 19].
To analyze the interannual variability of the mixed layer, the average values of the UML thickness in the Barents and Kara seas were calculated for the cold (November – April) and warm (May – October) halves of a year. The thickness values of this layer were found for the western (65–80°N; 16–36°E) and eastern (65–80°N; 36–56°E) regions of the Barents Sea as well as for the western (65–80°N; 56–80°E) and eastern (65–80°N; 80–103°E) regions of the Kara Sea.
Analysis of results
The upper mixed layer of the Barents and Kara seas is formed due to mixing of waters coming from the adjacent basins of the Atlantic and Arctic oceans as well as continental runoff waters. The UML thickness spatial distribution depends on the processes of ice formation and melting, development of autumn-winter convection and is also largely determined by the bottom relief .
Fig. 1 shows the UML thickness climatic intra-annual variation averaged over the water areas of the Barents and Kara seas. According to the analysis, this layer reaches its maximum development in February and March and its minimum in June and July. The UML thickness increases from east to west. Thus, its greatest values in the seas under consideration are observed during the period of autumn-winter convection development which occurs as a result of density increase in the surface layer with a decrease in water temperature and salinization due to ice formation in the upper sea layers.
In this period, the UML is considered as a layer of water involved in the processes of intensive autumn-winter convection which averages 105 m in the Barents Sea (from 65 m in November to 125 m in February) (Fig. 1, a). The estimates obtained for the Barents Sea are less than those given in [13], according to which the UML thickness in this sea in the winter period is 170 m.
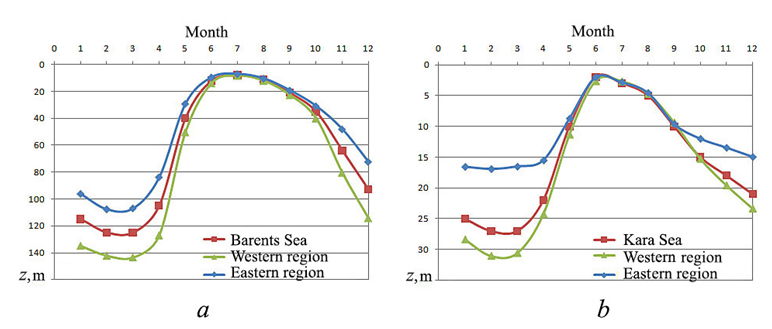
F i g. 1. Climatic intra-annual variation of UML thickness in the Barents (a) and Kara (b) seas
In the cold half of a year (November – April), the greatest UML thickness (360–390 m) is observed in the deepest areas of the Barents Sea (Western Trough, Central Basin), with its maximum in February and March (Fig. 2). This area is characterized by the distribution of non-freezing Atlantic waters where wind and air temperature are the most important factors determining stratification intensity. In winter, strong winds and low temperatures can cause mixing to depths of more than 200 m [20].
In the Barents Sea shallow areas (Central Bank, Gusinaya Bank, North Kanin Bank, Murmansk Rise), convection reaches the bottom earlier (November) than in the adjacent deep-water areas. In the northern part of the sea, convective mixing caused mainly by salinization during ice formation penetrates in the relative shallows, with the 50–100 m UML thickness (Fig. 2).
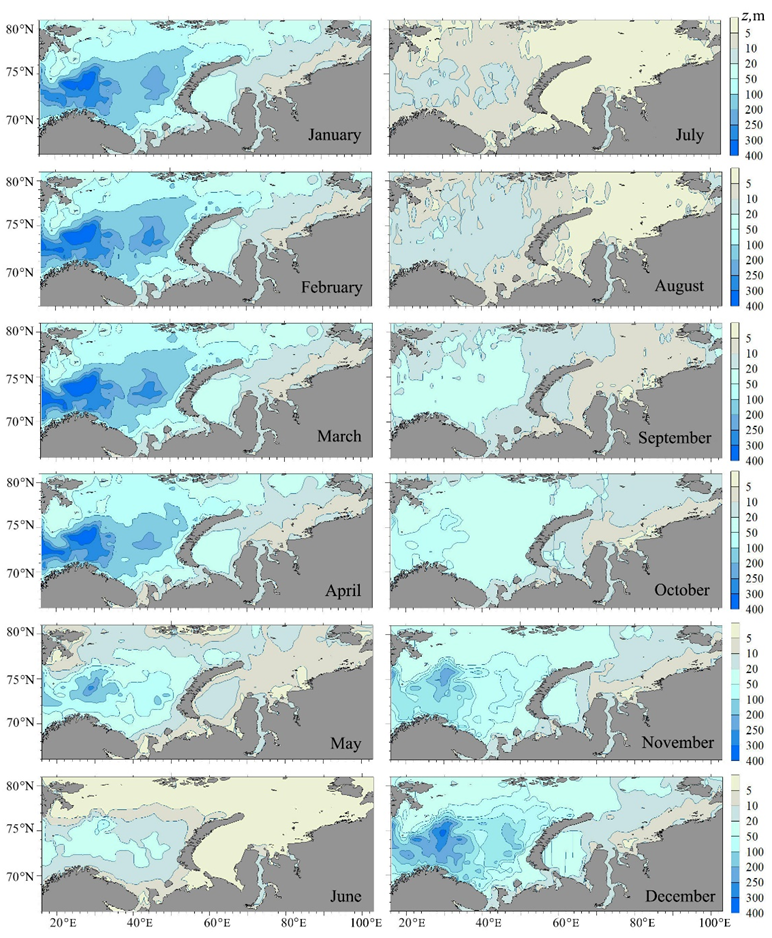
F i g. 2. UML thickness (m) in the Barents and Kara seas
In the Kara Sea, the average UML thickness during the cold season is 23 m (from 18 m in November to 27 m in February and March) (Fig. 1, b). Its maximum reaches about 130 m in March near the eastern shore of the Novaya Zemlya Archipelago (Fig. 2), where warmer homogeneous waters of the Barents Sea penetrate, equalizing the density vertically. The smallest UML thickness (up to 10 m) is observed in the Ob-Yenisei shallow waters in the area of the river plume distribution (Fig. 2).
In the warm period of a year (May – October), the upper layer density is significantly reduced during the maximum distribution of river waters, ice melting and surface heating. Steady stratification is observed and the layer with the maximum buoyancy frequency values rises to the surface [21]. The UML thickness averaged over the entire water area is 8 m (from 2 m in June to 15 m in October) for the Kara Sea (Fig. 1, b), 21 m (from 8 m in July to 40 m in October) for the Barents Sea (Fig. 1, a). The obtained estimates for the Barents Sea are higher than those given in [13], according to which the UML thickness in this sea is 18 m in the summer period.
In the warm and cold periods of a year, the greatest UML thickness is noted in the Barents Sea in its deep-water areas. During the cold half of a year (February – March), it reaches 270 m and in the warm half of a year, it does not exceed 23 m throughout the sea by July (Fig. 2).
The Kara Sea UML thickness in spring is 20 m, with its maximum noted in the southwest, near the eastern coast of the Novaya Zemlya Archipelago. By June, the UML thickness in almost all areas of the Kara Sea does not exceed 5 m. An exception is the Gulf of Ob, for which density is typically equalized vertically up to 20 m throughout the summer period due to increased runoff. This is especially noticeable in the Barents Sea southwestern part where the North Cape Current waters of high salinity and temperature pass. As they move east, these waters are cooled relatively quickly and then descend, smoothing out the difference in layer density [21–23].
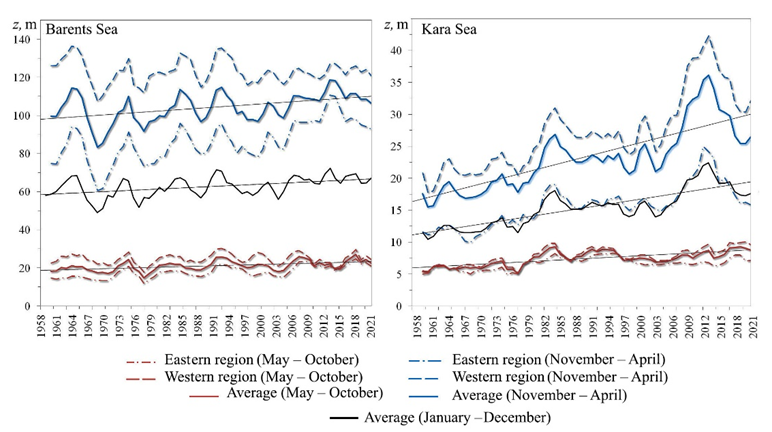
F i g. 3. Interannual variability of UML thickness, three-year moving average and linear trend for the Barents and Kara seas for 1958–2022
Fig. 3 demonstrates interannual variability of the UML thickness in the Barents and Kara seas in the cold and warm halves of a year. In these seas, the thickness of this layer changes synchronously and the correlation coefficient between the average annual thickness values is 0.62. Trend of the average annual UML thickness for the Barents Sea was 1.3 m/10 years, for the Kara Sea 1.2 m/10 years. Trend of the UML thickness for the Barents and Kara seas in the cold half of a year was 1.9 m/10 years and 2.1 m/10 years, in the warm half of a year 0.7 m/10 years and 0.4 m/10 years, respectively.
Analysis of the results revealed that an increase in the UML thickness was observed up to 72 m in the Barents Sea and up to 14 m in the Kara Sea in the mid-1960s (Fig. 3). It is known that large positive air temperature anomalies were noted in the Arctic in the 1950s – early 1960s. They were accompanied by increased melting of snow and ice and an increase in continental runoff [24]. This contributed to fresh water accumulation and an increase in the UML thickness during this period.
The smallest thickness of the surface layer over the entire study period was noted in the late 1960s – early 1970s amounting to 45 and 10 m in the Barents and Kara seas, respectively. This period coincides with the Great Salinity Anomaly in the North Atlantic which is mainly the result of the removal of sea ice and fresh water from the Arctic Basin through the Fram Strait [24].
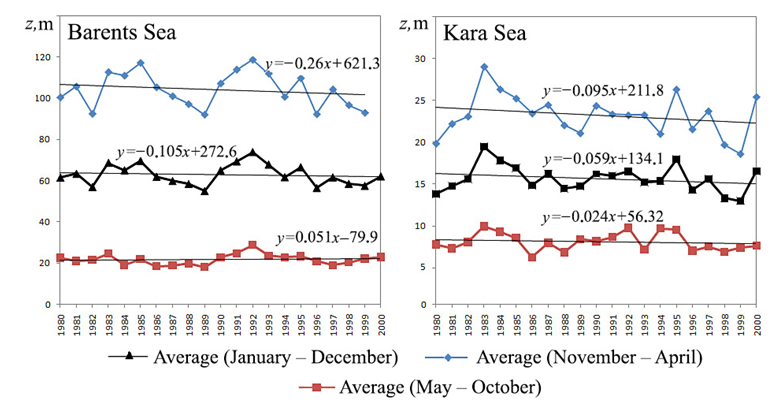
F i g. 4. Interannual variability of UML thickness and linear trend for the Barents and Kara seas for 1980–2000
The period from the late 1970s to the early 2000s is characterized by negative trends in the UML thickness (Fig. 4), which is consistent with the conclusions obtained in [13]. Since the early 2000s, an increase in the mixed layer thickness in the Arctic Basin has been observed due to the weakening of the Atlantic thermohaline circulation and intense summer warming in the Arctic in the 1990s – 2000s [5, 24].
Seasonal variations of the UML thickness trends in the Barents and Kara seas have regional features (Fig. 5). In the most dynamically active western region of the Barents Sea where a steady inflow of Atlantic waters takes place, the largest negative trends in the UML thickness are observed; it decreases in all months of a year. In January, the linear trend estimates reach 32 m/10 years.
The largest positive trends (42 m/10 years, February) were noted in the central and north-eastern regions of the Barents Sea in the cold half of a year. In the Kara Sea, negative trend values were noted against the background of a general steady tendency towards the UML thickness increase in the shelf zone.
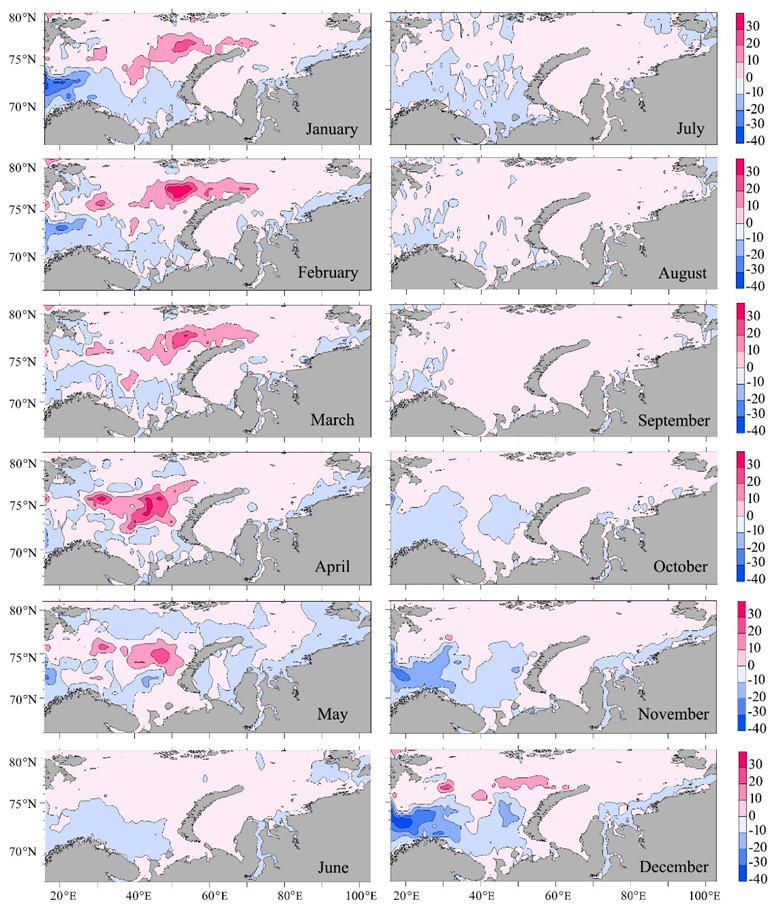
F i g. 5. Distribution of the linear trend coefficients (m/10 years) of UML thickness for 1958–2022
Conclusion
Based on the modern ORAS5 oceanographic data array for the long 1958–2022 period, the UML thickness climatic variability in the Barents and Kara seas was studied.
The analysis of the constructed average long-term fields of the UML thickness for the water areas of the seas under consideration made it possible to determine that the UML reaches its maximum vertical development in February and March and its minimum in June and July. Thus, the highest values of the UML thickness in the seas under consideration are observed during autumn-winter convection development. In the cold half of a year (November – April), the basin-averaged UML thickness is 105 m in the Barents Sea and 23 m in the Kara Sea.
In the warm period of a year (May – October), during the maximum distribution of river waters, ice melting and surface heating, the water column is stratified well by depth and the layer of maximum buoyancy frequency values rises to the surface. The average UML thickness over all water areas is 21 m for the Barents Sea and 8 m for the Kara Sea.
The difference of UML thickness values and their geographical distribution in the seas under consideration can be explained by the difference in such main influencing hydrological and atmospheric factors that form the UML spatial-temporal structure as water exchange with neighboring oceans, ice processes, fluctuations in river runoff, atmospheric processes, surface heating and cooling, wind-wave mixing.
Tendencies towards the UML thickness increase in the Eurasian part of the Arctic Basin have been noted since the early 1970s. In the 1950–1970 period, when minimum values of the surface layer thickness were noted, extremely low values of the Arctic and North Atlantic oscillations and negative anomalies of river runoff into the seas of the Russian Arctic were observed. At the same time, starting from the 1990s, an increase in positive values of the Arctic Oscillation Index with a simultaneous increase in positive anomalies of river runoff as well as significant negative anomalies of the Arctic ice cover area have been observed.
The analysis of interannual variability of the average annual values of the UML thickness in the Barents and Kara seas also revealed the presence of a positive climatic trend in 1958–2022, i.e. an increase in the UML thickness. The trend towards an increase in the UML thickness is observed both in the cold and warm halves of a year. The magnitude of the trend in the average annual UML thickness was 1.3 m/10 years for the Barents Sea and 1.2 m/10 years for the Kara Sea. The growth rate of the UML thickness for the Barents and Kara seas was 1.9 m/10 years and 2.1 m/10 years in the cold half of a year and 0.7 m/10 years and 0.4 m/10 years in the warm half of a year.
1. Luchin, V.A., 2018. Intra-Annual Variability of the Mixed Layer Parameters in the Okhotsk Sea. Izvestiya TINRO, 195(4), pp. 170-183. https://doi.org/10.26428/1606-9919-2018-195-170-183
2. Aagaard, K. and Coachman, L.K., 1975. Toward an Ice-Free Arctic Ocean. Eos, Transactions American Geophysical Union, 56(7), pp. 484-486. https://doi.org/10.1029/EO056i007p00484
3. Rudels, B., Anderson, L.G. and Jones, E.P., 1996. Formation and Evolution of the Surface Mixed Layer and Halocline of the Arctic Ocean. Journal of Geophysical Research: Oceans, 101(C4), pp. 8807-8821. https://doi.org/10.1029/96JC00143
4. Zakharov, V.F., 1996. Sea Ice in the Climate System. Saint Petersburg: Gidrometeoizdat, 213 p. (in Russian).
5. Cherniavskaia, E.A., Timokhov, L.A., Karpiy, V.Y. and Malinovskiy, S.Y., 2020. Interannual Variability of Parameters of the Arctic Ocean Surface Layer and Halocline. Arctic and Antarctic Research, 66(4), pp. 404-426. https://doi.org/10.30758/0555-2648-2020-66-4-404-426
6. Frolov, I.E., Gudkovich, Z.M., Karklin, V.P., Kovalev, E.G. and Smolyanitsky, V.M., 2007. Scientific Research in the Arctic. Vol. 2. Climatic Changes in the Ice Cover of the Eurasian Shelf Seas. Saint Petersburg: Nauka, 135 p. (in Russian).
7. Stroeve, J., Holland, M.M., Meier, W., Scambos, T. and Serreze, M., 2007. Arctic Sea Ice Decline: Faster than Forecast. Geophysical Research Letters, 34(9), L09501. https://doi.org/10.1029/2007GL029703
8. Kwok, R. and Rothrock, D.A., 2009. Decline in Arctic Sea Ice Thickness from Submarine and ICESat Records: 1958–2008. Geophysical Research Letters, 36(15), L15501. https://doi.org/10.1029/2009gl039035
9. Rostov, I.D., Dmitrieva, E.V., Rudykh, N.I. and Vorontsov, A.A., 2019. Climatic Changes of Thermal Condition in the Kara Sea at Last 40 Years. Arctic and Antarctic Research, 65(2), pp. 125-147. https://doi.org/10.30758/0555-2648-2019-65-2-125-147 (in Russian).
10. Ashik, I.M., ed., 2021. The Seas of the Russian Arctic in Modern Climatic Conditions. Saint Petersburg: AARI, 360 p. (in Russian).
11. Macdonald, R.W., Harner, T. and Fyfe, J., 2005. Recent Climate Change in the Arctic and Its Impact on Contaminant Pathways and Interpretation of Temporal Trend Data. Science of the Total Environment, 342(1-3), pp. 5-86. https://doi.org/10.1016/j.scitotenv.2004.12.059
12. Frolov, I.E., Ashik, I.M., Kassens, H., Polyakov, I.V., Proshutinsky, A.Yu., Sokolov, V.T. and Timokhov, L.A., 2009. Anomalous Variations in the Thermohaline Structure of the Arctic Ocean. Doklady Earth Sciences, 429(2), pp. 1567-1569. https://doi.org/10.1134/S1028334X09090323
13. Peralta-Ferriz, S. and Woodgate, R.A., 2015. Seasonal and Interannual Variability of Pan-Arctic Surface Mixed Layer Properties from 1979 to 2012 from Hydrographic Data, and the Dominance of Stratification for Multiyear Mixed Layer Depth Shoaling. Progress in Oceanography, 134, pp. 19-53. https://doi.org/10.1016/j.pocean.2014.12.005
14. Vlasenkov, R.E., Smirnov, A.V. and Makshtas, A.P., 2010. Estimation of Potential Heating of the Surface Layer of the Kara and Laptev Seas in 2007 and 2008. Arctic and Antarctic Research, (2), pp. 35-39 (in Russian).
15. Sirevaag, A., De La Rosa, S., Fer, I., Nicolaus, M., Tjernström, M. and McPhee, M.G., 2011. Mixing, Heat Fluxes and Heat Content Evolution of the Arctic Ocean Mixed Layer. Ocean Science, 7(3), pp. 335-349. https://doi.org/10.5194/os-7-335-2011
16. Bukatov, A.A., Pavlenko, E.A. and Solovei, N.M., 2023. River Runoff Influence on the Density Stratification of the Russian Arctic Seas. In: T. Chaplina, ed., 2023. Processes in GeoMedia – Volume VI. Springer Geology Series. Cham: Springer, pp. 523-536. https://doi.org/10.1007/978-3-031-16575-7_47
17. Smirnov, A.V. and Korablev, A.A., 2010. Interrelationship between Mixed Layer Characteristics and Atmospheric Heat Fluxes in the Nordic Seas. Arctic and Antarctic Research, (3), pp. 79-88 (in Russian).
18. Toole, J.M., Timmermans, M.L., Perovich, D.K., Krishfield, R.A., Proshutinsky, A. and Richter-Menge, J.A., 2010. Influences of the Ocean Surface Mixed Layer and Thermohaline Stratification on Arctic Sea Ice in the Central Canada Basin. Journal of Geophysical Research: Oceans, 115(C10), C10018. https://doi.org/10.1029/2009JC005660
19. Jackson, J.M., Williams, W.J. and Carmack, E.C., 2012. Winter Sea-Ice Melt in the Canada Basin, Arctic Ocean. Geophysical Research Letters, 39(3), L03603. https://doi.org/10.1029/2011gl050219
20. Lisitsyn, A.P., ed., 2021. The Barents Sea System. Moscow: GEOS, 672 p. https://doi.org/10.29006/978-5-6045110-0-8/(4) (in Russian).
21. Bukatov, A.A., Pavlenko, E.A. and Solovei, N.M., 2018. Features of Spatial-Time Variability of Väisälä-Brunt Frequency in Barents and Kara Seas. Processes in GeoMedia, 3(16), pp. 1004-1013 (in Russian).
22. Bukatov, A.A., Solovei, N.M. and Pavlenko, E.A., 2023. Regional Features of Water Density Stratification and Internal Wave Characteristics in the Arctic Seas. Physical Oceanography, 30(6), pp. 731-746.
23. Ivanov, V.V., Frolov, I.E. and Filchuk, K.V., 2020. Transformation of Atlantic Water in the North-Eastern Barents Sea in Winter. Arctic and Antarctic Research, 66(3), pp. 246-266. https://doi.org/10.30758/0555-2648-2020-66-3-246-266
24. Viazilova, A.E., Alekseev, G.V., Balakin, A.A. and Smirnov, A.V., 2015. Influence of the Arctic on Salinity Anomaly Formation in the North-West Atlantic and North European Basin. Arctic and Antarctic Research, (3), pp. 39-50 (in Russian).