Russian Federation
Purpose. The study is purposed at identifying the variability features of the Angstrom parameter values obtained at the Black Sea stations Sevastopol and Section_7 of the AERONET network from spring 2019 to spring 2024 based on the satellite and ground monitoring data, as well as the results of atmospheric dynamics modeling. Methods and Results. Comparative analysis and assessment of the Angstrom parameter values involved application of the following information on atmospheric aerosol: the data of ground-based measurements derived by a portable SPM photometer, the photometer at the stations of the AERONET international aerosol monitoring network, the VIIRS radiometer platform from the Suomi NPP satellite, the data on concentrations of suspended particles of PM2.5 and PM10 resulted from the Espada M3 detector measurements, as well as the results of atmosphere dynamics modeling (data of the HYSPLIT and SILAM models). The comparative analysis made it possible to reveal the dates on which the optical characteristics corresponding to dust aerosol were recorded at one of two indicated stations in the Black Sea, whereas at the other one, no aerosol of this type (i.e. optical characteristics corresponded to a clean atmosphere) was detected. This fact confirms the different aerosol loading in the atmosphere over the western and central parts of the Black Sea, and also the spatial variability of aerosol basic optical characteristics during dust transport from the Sahara Desert. The measurements of the PM2.5 and PM10 particle concentrations performed on the days with the background optical characteristics of atmospheric aerosol permitted to obtain the values of background characteristics of suspended particles: PM2.5 = 7 µg/m3 and PM10 = 8 µg/m3). Conclusions. Low values of the Angstrom parameter (less than 0.8) do not by themselves indicate the presence of an aerosol, such as dust or smoke, in the atmosphere. However, being combined with high (exceeding the background values by more than 1.5 times) values of aerosol optical thickness and concentrations of PM2.5 and PM10 particles (exceeding the background values by more than 3 times), the data set is an evidence of the presence of aerosol – dust or smoke – in the atmosphere. It is noted that the aerosols of such types can be detected by the measurements of PM2.5 and PM10 particle concentrations only when they are in the atmosphere surface layer. Therefore, the conclusions on presence of these types of aerosols in the atmosphere, being based only on the measurements of calculated concentrations, are not reliable.
SPM, AERONET, VIIRS, SILAM, reverse trajectories, HYSPLIT, Angstrom parameter, dust aerosol, aerosol, smoke, spectral coefficient of sea brightness, aerosol optical thickness, AOD, Black Sea, atmospheric aerosol, satellite monitoring, ground monitoring, optical characteristics
Introduction
The need to study various types of aerosols is due to a number of factors affecting the upper layer of water in basins. Firstly, aerosols can be transported over significant distances from their sources, thereby influencing changes in the chemical composition of the atmosphere above regions [1, 2].
Secondly, aerosols of various origins affect the accuracy of the reconstruction of the spectral variability of the radiance coefficient of upward radiation [2–4]. Since the bio-optical characteristics of water bodies are analyzed by satellite data, in order to correctly assess these characteristics, it is necessary to consider what kind of aerosol is present in the atmosphere above the region under study [5–9]. Aerosols (such as dust and smoke) do not provide an opportunity to obtain objective estimates because the standard atmospheric correction algorithm used by NASA does not take into account the stratification of such aerosols [1, 10].
Thirdly, aerosol contains microelements, especially nitrogen, phosphorus, and silicon, which can serve as additional nutrient sources for phytoplankton when deposited in the upper layer of water bodies [11, 12]. Depending on which type of aerosol is identified in the atmosphere above the region under study as a result of transport, it is determined which microelements will end up in the upper layer of water after precipitation.
Currently, various aerosol fractions, i.e., the distribution of aerosol particles according to their size, are widely studied. The coarse fraction (0.6–10 μm) falls in the range of near-zero values of the Angstrom indices. The situation with the submicron fraction of the aerosol (0.1–0.6 μm) is more complicated, since the Angstrom parameter varies with a shift of the maximum of the size distribution function within this interval.
During the development of a dust storm, heat exchange processes and changes in the dynamics of microphysical processes are accompanied by strong winds and the intrusion of a cold air front. This leads to the transport of a large amount of the aerosol dust fraction with particles larger than 2 μm and to a decrease in the content of the finely dispersed (submicron) fraction, which is explained by the following causes:
1) intrusion of denser air masses with high dust content, which can lead to mechanical displacement of suspended particles of the submicron fraction into higher air layers;
2) adhesion of submicron fraction aerosol particles to coarse fraction dust particles;
3) expulsion of finely dispersed negatively charged dust particles by the negative electrostatic field of the earth’s surface.
Particles in the background submicron fraction that collide with larger dust storm particles and take electrons from them become negatively charged, and coarser particles become positively charged. The submicron particles then rise higher under the influence of the Earth’s electrostatic field. The development of a dust storm promotes processes that include the acquisition of a negative charge as a result of collisions between fine particles and a positive charge between large particles, which promotes the stratification of the dust cloud. This is why dust haze can be observed in stripes [13]. As a result, the ejection of soil particles by electrostatic forces increases. Measurements of ion concentration in the dispersed phase of air at 500 and 6000 m level in a clean and dusty atmosphere [14–16] indicate an increase in the concentration of negatively charged ions and a simultaneous decrease in the number of positively charged ions during a dust storm, which also confirms the electrostatic hypothesis.
Heavy dust storms are often followed by prolonged torrential rainfall, even in summer. In this case, the most wash-out resistant component of the atmospheric aerosol is the submicron fraction. It remains in the atmosphere after intense rainfall, and the coarse fraction decreases to almost 0. After rainfall, the coarse fraction of the aerosol is completely restored in the atmosphere only after several days. An additional band appears in the spectrum at 1300 cm−1; it is associated with an increase in the nitrate content of the aerosol. The decrease of the band at 1400 cm−1 compared to 1300 cm−1 is associated with the decrease of inorganic carbonates. The silicate content in the submicron fraction of the aerosol decreases.
Studies of the main optical properties over the Black Sea have been relevant and in demand since the beginning of the 20th century, although a detailed analysis of the spatio-temporal variability of the Angstrom parameters for this region is still a poorly understood problem in marine and atmospheric optics.
The purpose of the study is to perform a comparative analysis and estimation of Angstrom parameter values obtained at the Black Sea stations Sevastopol and Section_7 of the AERONET network from spring 2019 to spring 2024 using satellite and ground-based monitoring data, as well as the results of atmospheric dynamics modeling.
Research methods and instruments
In this work, the following types of atmospheric aerosol data have been used: data from measurements with a portable SPM photometer [17], photometers from stations of the international aerosol monitoring network AERONET, the VIIRS radiometer from the Suomi NPP satellite [18–20]; data from the HYSPLIT and SILAM models, as well as PM2.5 and PM10 particle concentrations obtained from measurements with the Espada M3 detector. Particulate matter (PM) is an atmospheric pollutant that is most often analyzed in terms of mass concentrations of particles.
The Angstrom parameter (α) is the exponent name in the formula for the dependence of aerosol optical thickness on the wavelength
![]()
where ![]() is the optical thickness at a given wavelength;
is the optical thickness at a given wavelength; ![]() is the standard (reference) wavelength .
is the standard (reference) wavelength .
The aerosol optical depth (AOD) of the atmosphere is most commonly calculated using the Bouguer law, which is based on the spectral attenuation of direct solar radiation. In this case, the light attenuation due to the Rayleigh molecular scattering and absorption by the gaseous components of the atmosphere is calculated to determine the AOD, which is then subtracted from the total optical depth of the atmosphere [21]. AOD is an indicator of the variability of the optical properties of the atmosphere due to the correlation between the concentrations of aerosol particles and the light attenuation coefficients, the data of which are obtained through the widespread use of satellite remote sensing methods [22, 23]. Various aerosol fractions, i.e., the distribution of aerosol particles according to their size, are widely studied nowadays. The coarse fraction (0.6-10 μm) falls in the range of near zero values of the Angstrom indices. The situation with the submicron fraction of the aerosol (0.1-0.6 µm) is more complicated, since the Angstrom parameter varies with a shift of the maximum of the size distribution function within this interval.
In this work, for the calculation of the AOD we use the measurements of photometers (SPM and CIMEL) at wavelengths l within 340−2134 nm, except for the 936 nm channel, according to the measurements on which the water vapor content in the atmospheric column is determined [17, 22, 23].
The Visible Infrared Imaging Radiometer Suite (VIIRS) provides Deep Blue NASA Standard Level-2 (L2) aerosol products from the Joint Polar Satellite System (JPSS). VIIRS provides satellite measurements of AOD and aerosol properties over land and ocean as daily data with a 6-min step. To obtain AOD values, the VIIRS Deep Blue Aerosol (DB) algorithm has been proposed since February 17, 2018 [21]. Based on the results of the algorithms, an array of scientific data containing information on 55 layers is created. The DB algorithm is designed to determine the aerosol type over land, and the Satellite Ocean Aerosol Retrieval (SOAR) algorithm – over water (water areas). As a result of processing the signals received at certain operating ranges of VIIRS, the data on AOD L2DeepBlue are obtained by two algorithms, and this is a reference data at the wavelength of 550 nm [18−20].
Both algorithms allow to determine the atmospheric aerosol type during the daytime in the absence of clouds and snow. On land, the aerosol type is classified based on the AOD values, the Angstrom parameter (α), the Lambert Equivalent Reflectivity (LER), and the brightness temperature. The combined aerosol type over land and ocean is determined based on pixels that have passed the quality check [20].
The SILAM software package is widely used to study the impact of forest fires, volcanic eruptions, dust transport and other natural and industrial disasters on atmospheric pollution in general. The calculation scheme for these effects is based on the Lagrange – Euler model. The SILAM pollutant dispersion computer modeling system developed by the Finnish Meteorological Institute is a modern, powerful tool for modeling the dispersion characteristics of aerosols, gas components, dust particles, radionuclides, and natural allergens in the atmosphere [24].
The SILAM model provides the maps showing concentrations of fine particles up to 2.5 µm in diameter (PM2.5) and coarse particles up to 10 µm in diameter (PM10) at 10 m above ground level. Local pollution cannot be identified with the SILAM model, but it visualizes global pollution well [24–27].
In order to find sources of different types of aerosols over the Black Sea, the HYSPLIT software package for modeling reverse trajectories of flow motion is used in this work. For estimating the concentration of particulate matter, the results of measurements by the Espada M3 detector (http://www.ocrkj.com) of Chinese manufacture are used. They provide air quality monitoring according to the following parameters:
- PM2.5 is aerosol microparticles (PM2.5 and PM10 measurement range 0−2500 μg/m³);
- PM10 is aerosol particles larger than 10 μm;
- TVOC is volatile organic compounds, including toxic benzene and styrene (TVOC measurement range is 0 – 2.5 mg/m³);
- AQI is Air Quality Index, one of the integrated indicators of air pollution in the atmosphere. The air quality index is a piecewise linear function of the concentration of pollutants in the atmosphere: sulfur dioxide (SO2), nitrogen dioxide (NO2), PM10 and PM2.5, carbon monoxide (CO), and ozone (O3). The US Environmental Protection Agency (EPA) has established national air quality standards for each of these pollutants. The AQI calculation is based on the ratio of the measured average concentration of a pollutant to its standard (allowable) concentration.
The detector has a color TFT display for showing information about the air condition on several screens. LED ring is an air quality indicator and can change color from green to red depending on the values of the measured parameters, where green corresponds to the norm and red – to the critical level of pollution.
Results
As a result of measurement data retrieval from the SPM photometer of Sevastopol station and the CIMEL photometer of the Section_7 station of the international AERONET network for the period from 27.08.2019 to 31.03.2024, 60 dates were obtained on which the calculated values of the Angstrom parameter at the stations differed by more than 2.5 times. Figure 1 indicates five dates where the α values differed by more than 10 times. Out of 60 dates of the period under study, 17 of them showed differences in values of more than 5 times. The maximum difference in the values of the Angstrom parameters (more than 27 times) was obtained on 09.09.2020 (αSPM = 0.05, and αAERONET = 1.46). Such a difference in values indicates that different types of aerosol were observed in the atmosphere over the western and central parts of the Black Sea.
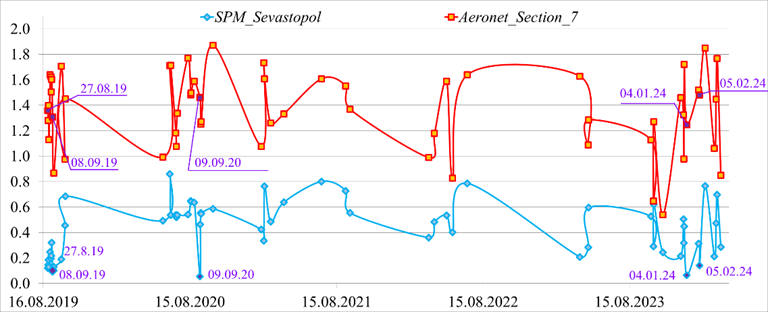
F i g. 1. The Angstrom parameter values at the stations of AERONET network: Sevastopol – based on the SPM photometer data, and Section_7 – based on the CIMEL photometer data
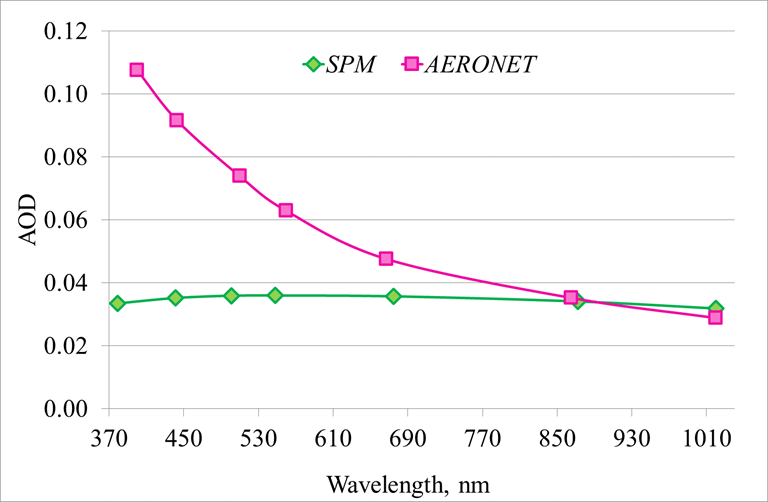
F i g. 2. Spectral variability of AOD values at the stations of AERONET network: Section_7 – based on the CIMEL photometer measurements, and Sevastopol – based on the SPM photometer data on 09.09.2020
The analysis of the main optical characteristics revealed that the AOD spectral behavior obtained from the data of two photometers for 09.09.2020 varies greatly in the wavelength range of 380-680 nm. For example, a comparative analysis of the AOD values at a wavelength of 500 nm (AOD(500)) showed a twofold difference in values. However, it is worth noting that both at Sevastopol station and Section_7 station the obtained AOD values are several times lower than the background values (for Sevastopol station AOD(500) = 0.036 at a background AOD(500) = 0.18, and for Section_7 AOD(510) = 0.074 at a background AOD(510) = 0.15 (Fig. 2)). When studying the atmosphere over different regions, the background characteristics of the atmospheric aerosol are determined to identify anomalous situations. In this paper, background aerosol refers to the average values of the optical properties, excluding outliers (jumps in values).
Analysis of satellite images on 09.09.2020 revealed that the atmosphere over the Black Sea was clear (minimal cloudiness) (Fig. 3, a). For all studied areas of the Black Sea region, the predominant aerosol type for that day was indicated using the DB algorithm: over the western part of the Black Sea – dust and mixed, and over the Sevastopol station – background (Fig. 3, b).
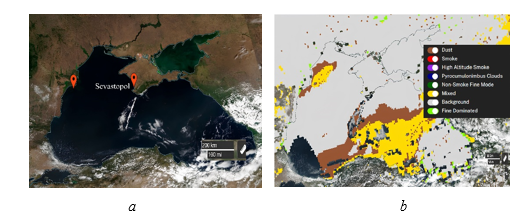
F i g. 3. VIIRS spectroradiometer images: color-synthesized in natural colors (TrueColor) (a), and obtained using the Satellite Ocean Aerosol Retrieval algorithm (b) for 09.09.2020 (Source: AERDB_L2_VIIRS_NOAA20_NRT doi:10.5067/VIIRS/AERDB_L2_VIIRS_NOAA20_NRT.002; AERDB_L2_VIIRS_NOAA20 doi:10.5067/VIIRS/AERDB_L2_VIIRS_NOAA20.002)
For the day with the maximum variation of the α-values, the HYSPLIT modeling data of the reverse trajectories (Fig. 4) and the SILAM loading data of the dust aerosol (Fig. 5) were analyzed. The HYSPLIT model results revealed that at two heights (2000 and 3000 m) the transport from the northeast is recorded for both stations. The data on the transport direction at 1500 m height are different: for the western Black Sea station Section_7 transport from the northeast is observed, and for Sevastopol station (as well as for two other heights) – from the northwest (Fig. 4, a).
The dust aerosol loading data from the SILAM model were used to obtain the dust concentrations for both stations. As shown in Fig. 5, a, the dust concentration at Sevastopol station on 09.09.2020 was zero (no dust detected), while at the western Black Sea station its value reached 60 μg/m3 at 14:00. According to Figure 5, b, the source of dust activity on this day moved from the Karakum Desert along the Caspian Sea towards the northwest, and the reverse trajectories, according to the HYSPLIT model results for Section_7 station, passed precisely through the area of the dust cloud (see Fig. 4, b).
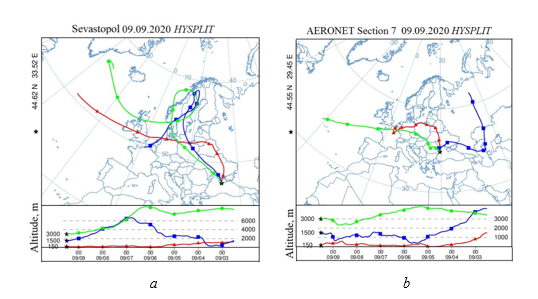
F i g. 4. Reverse trajectories of air flow transfer based on the results of HYSPLIT modeling for the stations of AERONET network: Sevastopol (а) and Section_7 (b) for 09.09.2020 (Available at: http://ready.arl.noaa.gov/HYSPLIT.php)
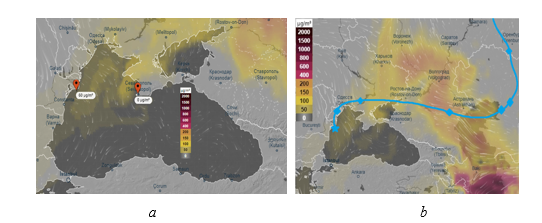
F i g. 5. Results of modeling dust concentration in the atmosphere based on the SILAM data for the stations of AERONET network Sevastopol and Section_7 for 09.09.2020 (Available at: https://thredds.silam.fmi.fi/thredds/catalog/catalog.html)
As a result of the analysis of variability of the Angstrom parameter (Fig. 1), the period from 27.08.2019 to 30.09.2019 was indicated, when the values of two stations differed by 5 times or more during the month. The maximum difference of 13 times was recorded on 08.09.2019 (αSPM = 0.1, and αAERONET = 1.31), and the minimum difference of 5 times was recorded on 06.09.2019 (αSPM = 0.3, and αAERONET = 1.6). The dates 27.08.2019 and 30.09.2019, when the Angstrom parameter values differed by 11 and 9 times, respectively, are also indicated in Fig. 6.
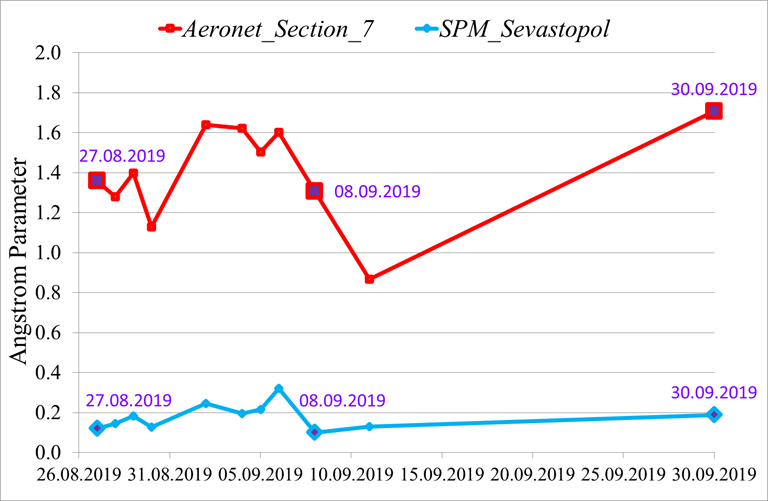
F i g. 6. The Angstrom parameter for the stations of AERONET network Sevastopol and Section_7 for the period 27.08.2019–30.09.2019
Another quality characteristic of atmospheric air and aerosol is the concentration of PM2.5 and PM10 particles. The concentration of particles is obtained only for the ground layer, which is why the characteristic cannot fully reflect the situation of aerosol loading. This characteristic is applied to estimate local emissions, for example, near industrial facilities or near agricultural fields where insecticides are utilized. AOD, unlike PM concentration, is measured in the entire column of the atmosphere [18, 22], thus, its analysis is more often used to determine the atmospheric condition over the region under study.
In order to exclude the influence of local emissions of aerosol pollution caused by large-scale aerosol transport from June 2023 to May 2024 on the accuracy of particle concentration determination, we analyzed a dataset comprising PM2.5 and PM10 particle concentrations obtained from the Espada M3 detector, AOD spectral values from the SPM photometer, VIIRS satellite data, and aerosol data from the SILAM model. Analysis of all these data is required to assess the impact of aerosol deposition on the surface layer of the Black Sea. The detection of aerosol containing trace elements (nitrogen, phosphorus, and silicon) is important, since during deposition it enters the upper layer of water bodies and can subsequently cause a short-term increase in phytoplankton bioproductivity [28−32]. When the additional supply of trace elements ceases, bioproductivity returns to the original level.
Previously, background values of the main optical characteristics were obtained for Sevastopol station [13, 33]. For days with such characteristics we performed variability analysis of PM2.5 and PM10 values, which made it possible to obtain background values of concentration of small and large particles: PM2.5 = 7 μg/m3, PM10 = 8 μg/m3.
Throughout the day of November 30, low AOD values relative to the background ones were observed (average daily value of AOD(500) = 0.06). However, the particle concentration values, according to the measurements of the Espada M3 detector, exceeded the background values for that day by more than three times (PM2.5 = 23 μg/m3, PM10 = 25 μg/m3). Analysis of the contribution of large and small particles to the total AOD distribution for this day revealed the dominance of fine aerosol (85%). Particle concentration data from the SILAM model demonstrated minimal discrepancies with the field data (Fig. 7). These values of AOD and particle concentrations show that on 30.11.2023 the aerosol did not reach the layers of the upper atmosphere, the aerosol effect was local in the surface layer of the atmosphere up to 50 m (measurements were carried out at 45 m height), and the ground aerosol made a minimal contribution to the total AOD value of the entire atmospheric layer.
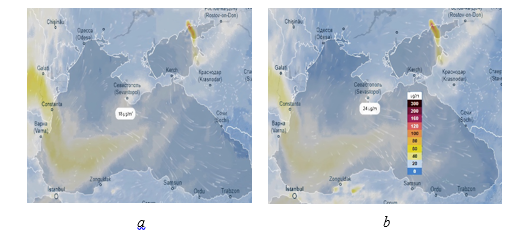
F i g. 7. Results of simulating the concentrations of PM2.5 (а) and РМ10 (b) particles based on the SILAM data at 22:00 on 29.11.2021
In the period from 07.10.2023 to 07.11.2023, abnormally low values of the Angstrom parameter and AOD were obtained (Fig. 8). Out of 13 days of measurements, only on one day (23.10.2023) the values of the aerosol optical depth (AOD(500) = 0.26) exceeded the background values, however, the values of the Angstrom parameter (α = 0.3) for this day were also much lower than the background value (α = 1.25). Sunny clear weather was observed on 23.10.2023 until 14:00. During this period of the day, the values of the main optical properties were different from the background values. This corresponds to the presence of aerosol in the atmosphere, such as dust aerosol or smoke. At the same time, according to the Espada M3 detector, the concentration values of PM2.5 particles did not exceed 12 μg/m3 and PM10 – 13 μg/m3.
After 14:00, a continuous dense haze appeared in the sky, making it impossible to continue measurements with the photometer. However, measurements with the detector do not depend on the presence of the sun, so the monitoring of the concentration values was continued. As a result of the measurements, a gradual increase in the concentration of particles was recorded: at 17:30 the PM2.5 values were 27 μg/m3 and PM10 values were 34 μg/m3; at 21:30 they reached a maximum – PM2.5 = 31 μg/m3 and PM10 = 36 μg/m3. This type of variability of atmospheric parameters indicates that aerosol particles were above the surface layer at the beginning of the day (which was confirmed by increased AOD values), and then, gradually settling on the underlying surface, began to coagulate moisture, forming a layer of haze.
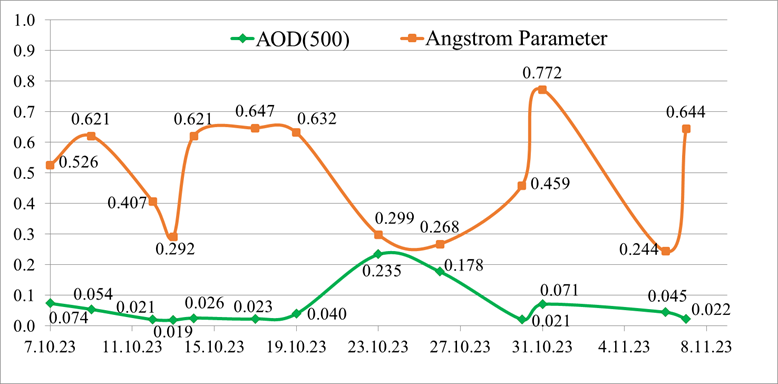
F i g. 8. The Angstrom parameter and АОD(500) based on the SPM photometer data at Sevastopol station
It is noteworthy that at the beginning and in the middle of the day large and small particles were present in the surface layer in average amounts (detector data within the annual average values of PM2.5 = 11 μg/m3 and PM10 = 12 μg/m3). Intense deposition of aerosol particles began after 14:00, due to this fact their maximum amount fell on the underlying surface at 21:30, which is confirmed by the maximum values of the concentration of PM2.5 and PM10 particles. Satellite data confirm the transport of dust aerosols from the Sahara on 23.10.2023 (Fig. 9, a, b). VIIRS AOD(500) values in the range from 0.27 to 0.275 (marked on the scale (Fig. 9, c)) are close to the photometric natural values obtained at Sevastopol station.
Previous studies have shown that dust transport events over the Black Sea last from 1 to 10 days [1, 13, 34]. To determine the onset of the transport event, data from the second half of October were analyzed. The AOD values on 19.10.2023 obtained at Sevastopol station from SPM measurements corresponded to the AOD values of a clear atmosphere (AOD(500) = 0.040), as did the VIIRS satellite data AOD(500) = 0.04, which are in complete agreement with the field data (marked on the AOD scale (Fig. 10, a)). The chlorophyll a concentration values for this day are typical for October (Fig. 10, b).

F i g. 9. Satellite images of dust transfer obtained by the VIIRS spectroradiometer for 23.10.2023: color-synthesized in natural colors (TrueColor) (а); obtained using the Satellite Ocean Aerosol Retrieval algorithm (b) and obtained using satellite AOD(500) measurements (c)
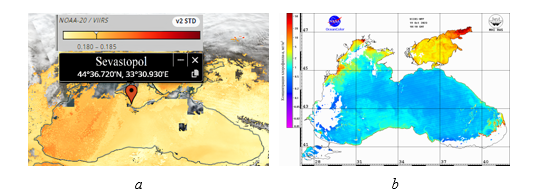
F i g. 10. Spatial distribution of aerosol optical depth at a wavelength 500 nm (а) and chlorophyll a concentration based on the VIIRS satellite data obtained over the Black Sea region (b) for 19.10.2023
As early as 20.10.2023, the atmospheric parameters over the western part of the Black Sea water area and coast changed according to photometric, satellite and modeling data. It is the date of 20.10.2023 that marks the beginning of dust transport from the Sahara (Fig. 11). As can be seen in Fig. 11, the western part of the water surface, where the chlorophyll a concentration values were not determined, is not covered by clouds; thus, the absence of data can only be explained by the presence of a large number of aerosol particles over this area. This fact is confirmed by the high AOD values and the dominant dust type of aerosol according to the VIIRS radiometer data (Fig. 11).
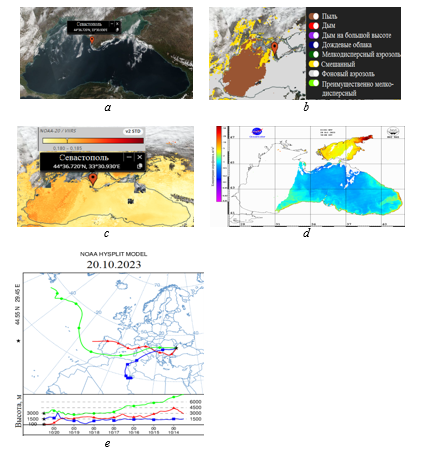
F i g. 11. Satellite images: color-synthesized in natural colors (TrueColor) (а), obtained using the Satellite Ocean Aerosol Retrieval algorithm (b), obtained using the AOD(500) satellite measurements (c) and chlorophyll a concentration (d) based on the VIIRS satellite data obtained over the Black Sea region on 20.10.2023; reverse trajectories of air flow transfer based on the results of HYSPLIT modeling for the western Black Sea station
Analysis of satellite, field and modeling data revealed that the end of dust transport over the Black Sea stations was recorded on 29.10.2023 (the dust plume shifted towards the southwestern coast during that day), and on 30.10.2023 dust aerosol was completely absent in the atmosphere over the entire Black Sea water area and coast. This means that low values of the Angstrom parameter alone do not indicate the presence of aerosol, such as dust or smoke in the atmosphere. However, in combination with high values of the aerosol optical thickness and the concentration of PM2.5 and PM10 particles, they give grounds to assert that there is an aerosol of these two types over the study area (at the same time, it cannot be asserted that it is present over the entire study area).
Conclusion
A comparative analysis of the Angstrom parameter values at the Black Sea stations Sevastopol and Section_7 allowed us to identify the dates when optical characteristics corresponding to dust aerosol were recorded at one station, while this type of aerosol was not recorded at the other station. This confirms different aerosol load over the western and central parts of the Black Sea and spatial variability of the main optical properties of the aerosol when recording dust transport from the Sahara Desert.
The measurements of PM2.5 and PM10 particle concentrations on days with background optical characteristics of atmospheric aerosol allowed us to obtain the values of the background characteristics of suspended particles (PM2.5 = 7 μg/m3, PM10 = 8 μg/m3).
The principal conclusion of the study is that low values of the Angstrom parameter in combination with high (exceeding the background ones by more than 1.5 times) values of the aerosol optical depth as well as high (exceeding the background ones by more than 3 times) values of the concentration of PM2.5 and PM10 particles indicate the presence of dust aerosol or smoke from fires in the atmosphere over the study area. However, if only low values of the Angstrom parameter are obtained at the photometric station, this does not indicate the presence of an aerosol such as dust or smoke in the atmosphere. This work reveals that the presence of these types of aerosols over one area of the Black Sea region (over Sevastopol) does not mean their presence over the entire Black Sea region.
1. Kalinskaya, D.V. and Varenik, A.V., 2019. The Research of the Dust Transport Impact on the Biogeochemical Characteristics of the Black Sea Surface Layer. In: SPIE, 2019. Proceeding of SPIE. 25th International Symposium on Atmospheric and Ocean Optics: Atmospheric Physics. Vol. 11208, 1120845. https://doi.org/10.1117/12.2540432
2. Korchemkina, E.N. and Kalinskaya, D.V., 2022. Algorithm of Additional Correction of Level 2 Remote Sensing Reflectance Data Using Modelling of the Optical Properties of the Black Sea Waters. Remote Sensing, 14(4), 831. https://doi.org/10.3390/rs14040831
3. Kopelevich, O.V., Saling, I.V., Vazyulya, S.V., Glukhovets, D.I., Sheberstov, S.V., Burenkov, V.I. and Yushmanova, A.V., 2018. Bio-Optical Characteristics of the Seas, Surrounding the Western Part of Russia, from Data of the Satellite Ocean Color Scanners of 1998–2017. Moscow: Institute of Oceanology RAS, 140 p. (in Russian).
4. Kopelevich, O.V., Sheberstov, S.V. and Vazyulya, S.V., 2020. [Underwater Light Field in the Surface Layer of the Barents Sea and the Spectral Brightness Coefficient of the Water Column under Various Oceanological Conditions]. In: SRI RAS, 2020. Proceedings of the 18th All-Russian Open Conference “Modern Problems of Remote Probing the Earth from Space”. Moscow: Space Research Institute of RAS Publishing, p. 216. https://doi.org/10.21046/18DZZconf-2020a (in Russian).
5. Korchemkina, E.N., Shibanov, E.B. and Lee, M.E., 2009. Atmospheric Correction Improvement for the Remote Sensing of Black Sea Waters. Issledovanie Zemli iz Kosmosa, (6), pp. 24-30 (in Russian).
6. Kopelevich, O.V., Burenkov, V.I. and Sheberstov, S.V., 2006. Development and Use of Regional Algorithms for Calculating the Bio-Optical Characteristics of the Seas of Russia from the Data of Satellite Color Scanners. Current Problems in Remote Sensing of the Earth from Space, 3(2), pp. 99-105 (in Russian).
7. Suetin, V.S., Korolev, S.N., Suslin, V.V. and Kucheryavyi, A.A., 2004. Manifestation of Specific Features of the Optical Properties of Atmospheric Aerosol over the Black Sea in the Interpretation of SeaWiFS Data. Physical Oceanography, 14(1), pp. 57-65. https://doi.org/10.1023/B:POCE.0000025370.99460.88
8. Suetin, V.S., Korolev, S.N., Suslin, V.V. and Kucheryavyi, A.A., 2008. Improved Interpretation of the Data of Observation of the Black Sea by a SeaWiFS Satellite Instrument in Autumn 1998. Physical Oceanography, 18(2), pp. 106-115. https://doi.org/10.1007/s11110-008-9011-9
9. Suetin, V.S., Korolev, S.N. and Kucheryavy, A.A., 2014. Application of Satellite Observations for Determining Spectral Dependencies of the Black Sea Waters Optical Characteristics. Morskoy Gidrofizicheskiy Zhurnal, (3), pp.77-86 (in Russian).
10. Khodzhakhon, M.I., Nazarov, B.I., Abdullaev, S.F. and Karieva, R.A., 2017. Mineralogical Composition of Dust Aerosol during Dust Storms. Doklady Akademii Nauk Respubliki Tadzhikistan, 60(1-2), pp. 64-67 (in Russian).
11. Varenik, A.V., 2017. Inorganic Nitrogen in the Atmospheric Precipitations in Sevastopol: Sources, Variations and Influence on the Surface Layer of Coastal Regions of the Black Sea. Problems of Environmental Monitoring and Modeling of Ecosystems, 28(6), pp. 75-84. https://doi.org/10.21513/0207-2564-2017-6-75-84 (in Russian).
12. Datsenko, Y.S. and Puklakov, V.V., 2020. Forecasting Phytoplankton Development in a Designed Low-Head Reservoir on the Don River. Water Resources, 47(1), pp. 103-112. https://doi.org/10.1134/S0097807820010042
13. Kalinskaya, D.V., 2012. Research of Optical Characteristics Features of Dust Aerosol over the Black Sea. In: MHI, 2012. Ecological Safety of Coastal and Shelf Zones and Comprehensive Use of Shelf Resources. Sevastopol: MHI. Iss. 26, vol. 2, pp. 151-162 (in Russian).
14. Kostianoy, A.G., 2017. Satellite Monitoring of the Ocean Climate Parameters. Part 1. Fundamental and Applied Climatology, (2), pp. 63-85. https://doi.org/10.21513/2410-8758-2017-2-63-85 (in Russian).
15. Kok, J.F. and Renno, N.O., 2006. Enhancement of the Emission of Mineral Dust Aerosols by Electric Forces. Geophysical Research Letters, 33(19), L19S10. https://doi.org/10.1029/2006GL026284
16. Nazarov, B.I., Maslov, V.A. and Abdulaev, S.F., 2010. Optical and Microphysical Parameters of Arid Dust Aerosol. Izvestiya, Atmospheric and Oceanic Physics, 46(4), pp. 468-474. https://doi.org/10.1134/S0001433810040055
17. Sakerin, S.M., Kabanov, D.M., Rostov, A.P., Turchinovich, S.A. and Knyazev, V.V., 2012. Sun Photometers for Measuring Spectral Air Transparency in Stationary and Mobile Conditions. Atmospheric and Oceanic Optics, 26(4), pp. 352-356. https://doi.org/10.1134/S102485601304012X
18. Cao, C., Xiong, J., Blonski, S., Liu, Q., Uprety, S., Shao, X., Bai, Y. and Weng, F., 2013. Suomi NPP VIIRS Sensor Data Record Verification, Validation, and Long-Term Performance Monitoring. Journal of Geophysical Research: Atmospheres, 118(20), pp. 11664-11678. https://doi.org/10.1002/2013JD020418
19. Wang, W., Mao, F., Pan, Z., Du, L. and Gong, W., 2017. Validation of VIIRS AOD through a Comparison with a Sun Photometer and MODIS AODs over Wuhan. Remote Sensing, 9(5), 403. https://doi.org/10.3390/rs9050403
20. Lee, J., Hsu, N.C., Kim, W.V., Sayer, A.M. and Tsay, S.-C., 2024. VIIRS Version 2 Deep Blue Aerosol Products. Journal of Geophysical Research: Atmospheres, 129(6), e2023JD040082. https://doi.org/10.1029/2023JD040082
21. Rosenberg, G.V., 1968. Optical Investigations of Atmospheric Aerosol. Soviet Physics Uspekhi, 11(3), pp. 353-380. https://doi.org/10.1070/PU1968v011n03ABEH003841
22. Dubovik, O. and King, M.D., 2000. A Flexible Inversion Algorithm for Retrieval of Aerosol Optical Properties from Sun and Sky Radiance Measurements. Journal of Geophysical Research: Atmospheres, 105(D16), pp. 20673-20696. https://doi.org/10.1029/2000JD900282
23. Dubovik, O., Holben, B., Eck, T.F., Smirnov, A., Kaufman, Y.J., King, M.D., Tanré, D. and Slutsker, I., 2002. Variability of Absorption and Optical Properties of Key Aerosol Types Observed in Worldwide Locations. Journal of the Atmospheric Sciences, 59(3), pp. 590-608. https://doi.org/10.1175/1520-0469(2002)059<0590:voaaop>2.0.co;2
24. Sofiev, M., Siljamo, P., Valkama, I., Ilvonen, M. and Kukkonen, J., 2006. A Dispersion Modelling System SILAM and Its Evaluation against ETEX Data. Atmospheric Environment, 40(4), pp. 674-685. https://doi.org/10.1016/j.atmosenv.2005.09.069
25. Frohn, L.M., Geels, C., Andersen, C., Andersson, C., Bennet, C., Christensen, J.H., Im, U., Karvosenoja, N., Kindler, P.A. [et al.], 2022. Evaluation of Multidecadal High-Resolution Atmospheric Chemistry-Transport Modelling for Exposure Assessments in the Continental Nordic Countries. Atmospheric Environment, 290, 119334. https://doi.org/10.1016/j.atmosenv.2022.119334
26. Tiwari, A., Soni, V.K., Jena, C., Kumar, A., Bist, S. and Kouznetsov, R., 2022. Pre-Operational Validation of Air Quality Forecasting Model SILAM for India. Journal of Pollution Effects & Control, 10(4), 343. https://doi.org/10.35248/2375-4397.22.10.343
27. Dementeva, A.L., Zhamsueva, G.S., Zayakhanov, A.S., Tcydypov, V.V., Starikov, A.V. and Balzhanov, T.S., 2019. Variability of Aerosol Concentrations of Fractions PM10 and PM2.5 in the Atmosphere Surface Layer at the Reference Monitoring Station Boyarsky. In: SPIE, 2019. Proceeding of SPIE. Vol. 12780: 29th International Symposium on Atmospheric and Ocean Optics: Atmospheric Physics. 127805X. https://doi.org/10.1117/12.2690736
28. Migon, C. and Sandroni, V., 1999. Phosphorus in Rainwater: Partitioning Inputs and Impact on the Surface Coastal Ocean. Limnology and Oceanography, 44(4), pp. 1160-1165. https://doi.org/10.4319/lo.1999.44.4.1160
29. Griffin, D.W. and Kellogg, C.A., 2004. Dust Storms and Their Impact on Ocean and Human Health: Dust in Earth’s Atmosphere. EcoHealth, 1(3), pp. 284-295. https://doi.org/10.1007/s10393-004-0120-8
30. Middleton, N. and Kang, U., 2017. Sand and Dust Storms: Impact Mitigation. Sustainability, 9(6), 1053. https://doi.org/10.3390/su9061053
31. Varenik, A.V. and Konovalov, S.K., 2021. Contribution of Atmospheric Precipitation to the Supply of Nutrients in the Area of the Crimean Coast. In: SSC RAS, 2021. Regularities in the Formation and Impact of Marine and Atmospheric Hazards and Disasters on the Coastal Zone of the Russian Federation in the Context of Global Climatic and Industrial Challenges (“Hazardous Phenomena-III”). Proceedings of the International Scientific Conference. Rostov-on-Don: Southern Scientific Center of the Russian Academy of Sciences, pp. 253-256.
32. Orekhova, N.A., 2021. Nutrients Dynamics in the Surface Waters of the Black Sea. Physical Oceanography, 28(6), pp. 660-676. https://doi.org/10.22449/1573-160X-2021-6-660-676
33. Kalinskaya, D.V., Kabanov, D.M., Latushkin, A.A. and Sakerin, S.M., 2017. Atmospheric Aerosol Optical Depth Measurements in the Black Sea Region (2015-2016). Optika Atmosfery i Okeana, 30(6), pp. 489-496. https://doi.org/10.15372/AOO20170607 (in Russian).
34. Kalinskaya, D.V. and Papkova, A.S., 2023. Variability of the Water-Leaving Radiance under the Conditions of Dust Transport by the Satellite Sentinel-3 Data on the Example of the Black Sea and Sevastopol. Physical Oceanography, 30(3), pp. 369-383.

