


Russian Federation
Russian Federation
Purpose. The purpose of the study consists in analyzing the spatial-temporal dynamics of pH and total alkalinity of the Sea of Azov waters in 1950–2020. Methods and Results. Statistical analysis of the data on the Sea of Azov for 1950–2020 derived from the oceanographic database of the Southern Scientific Center of RAS made it possible to determine the average long-term values of the parameters under consideration in the Taganrog Bay, the open part of the Sea of Azov and the Kerch Strait by seasons. For the first time, the long-term changes in pH and total alkalinity of the Sea of Azov waters, as well as the distribution features of these parameters in the regions affected by the river runoffs are shown. Conclusions. Two zones of low Alk values of seawater with the salinity ranges of 2–4 and 11–13‰ were identified in the Taganrog Bay. In these regions, under significant supersaturation of water with calcium carbonate the processes of chemogenic calcite formation are potentially possible. One zone of the increased pH values with the salinity range 4–6‰ coincides with the area of maximum phytoplankton productivity. In the Taganrog Bay, a pH increase in summer and autumn was noted, which can be explained by the growing production of organic matter against the background of salinity decrease starting from the second half of the 1970s and by a rise of water temperature in the first decade of the 2000s. The open part of the sea and the Kerch Strait are characterized by a general trend towards a decrease in pH values, except for the period of an intensive river runoff. The general pattern of Alk distribution in the Sea of Azov consists in its relatively elevated values in the Taganrog Bay (especially in the regions with salinity range of 5–8‰) which decrease towards the open sea and then increase towards the Kerch Strait. The average Alk value in the Taganrog Bay tended to decrease during the low-water periods (1972–1978 and 2011–2020) against the background of its general increase over the past seventy years. A noticeable growth of the average Alk values was noted during the period of increasing average water temperature in the Sea of Azov at the beginning of the 21st century
pH, total alkalinity, spatial-temporal dynamics, Sea of Azov, Taganrog Bay, Kerch Strait
Introduction
Total alkalinity (Alk) and pH are the parameters of the chemical equilibrium system of water bodies. They are applied in calculations of the content of the water carbonate system components, the direction of CO2 exchange between the sea and the atmosphere, and serve as origin indicators of water masses and photosynthetic processes [1–6]. The studies of long-term changes in these characteristics in relation to climate change and increased anthropogenic pressure on marine ecosystems and the ocean are of particular interest [7, 8].
The first systematic expeditionary observations of pH and Alk were carried out in the middle of the 20th century (1953–1959). A comprehensive review of these observations can be found in [9]. The materials of the studies performed by Azov-Black Sea Scientific Fisheries Station in 1953 and 1955, Hydrometeorological Observatory of the Black Sea and the Sea of Azov (HMO BSA) and State Oceanographic Institute (SOI) in 1958 and 1959 were summarized in the Hydrometeorological Handbook of the Sea of Azov and the fundamental work Hydrochemistry of the Sea of Azov (1964), which, among other things, revealed the main patterns of pH and Alk distribution.
In the subsequent period (from 1960 to the present), the measurement of Alk and pH was incorporated into the standard observation program for the spatio-temporal variability of hydrochemical parameters. These observations are conducted by organizations under the supervision of the Hydrometeorological Service (State Hydrometeorological Committee, now Roshydromet) and Fisheries (Ministry of Fisheries, now Rosrybolovstvo), as part of the state scientific and technical program for national development [9]. Hydrological and hydrochemical studies are carried out under the supervision of SOI and Azov Research Institute of Fisheries (Azov-Black Sea branch of VNIRO AzNIIRKH) on a single methodological basis. The program of AzNIIRKH marine measurements includes identification of hydrogen index but not the total alkalinity.
In 1991, SOI generalized the materials of expeditionary observations of the seasonal and spatial distribution of pH (a total of 6,320 observations) for the 1960–1985 period and Alk (a total of 5,000 observations) for the 1960–1981 period. The results are presented in the project “Seas of the USSR” (Volume 5. The Sea of Azov) During the 1990s, there was a decline in the number of pH and Alk observations, with these measurements being discontinued in certain sea areas.
In the 2000s and to the present day, observations of the considered parameters of the Sea of Azov waters have been carried out by the divisions of Roshydromet (Donskaya and Kubanskaya estuarine hydrometeorological stations; the Sevastopol branch of SOI, SB FSBI “SOI”); and the Southern Scientific Center of the Russian Academy of Sciences, SSC RAS, from 2002 to the present). Furthermore, from 1997 to 2008, research was conducted by the Azov branch of the Murmansk Marine Biological Institute (AzMMBI).
All organizations involved in the study of the hydrochemical regime of the Sea of Azov used the widely accepted method of hydrochemical determinations 2–, which is described in detail in the relevant practical guidelines .
Until 1960, the determination of pH colorimetric value using Palich boric-borate solutions with thymol blue and cresol red indicators was conducted immediately after the elevation of the bathometer on board the vessel 2. The colorimetric method for determining pH involves the introduction of temperature and salt corrections. The pH determination method 7 has been shown to have an operator-specific accuracy range of ±0.01–0.02, and in the case of different operators, up to 0.05 pH units. The method for determining pH using different types of pH meters (with a set of measuring electrodes) was later applied 7, 8. The absolute average systematic error in determining pH by this method 7 is 0.01–0.04 pH units. The majority of serial pH meters permit measurements with an accuracy of 0.02 pH units 9.
As stated in reference publications 2, 5, which provide a summary of the data for the period 1953–1980, the determination of total alkalinity was achieved through direct titration with hydrochloric acid. The application of a mixed indicator and the use of a blowing technique with a stream of air devoid of carbon dioxide were also reported 6, 7. Since the 2000s, the use of alkalinity titrators based on the potentiometric method of determination has become prevalent in research. The titration process is conducted automatically, thereby eliminating the need for operator intervention and resulting in enhanced efficiency and precision. The total error of this method, as defined in RD 52.10.243-92 8, is 4.7%.
Consequently, over the past seventy years, a large volume of information on the pH and Alk of the Sea of Azov waters was obtained. This information has been accumulated within the framework of the standard program of expeditionary observations of Roshydromet and the Russian Academy of Sciences organizations. Moreover, the latest generalization of long-term data on pH and Alk (for 1960–1985) was carried out in the work entitled “Hydrometeorology and hydrochemistry of the seas of the USSR. Vol. 5. The Sea of Azov” 4 (1991). A considerable amount of time has passed since that study was conducted, and significant changes in the hydrological, hydrochemical, hydrobiological and sedimentation processes in the Sea of Azov have been observed as a result of climatic fluctuations and anthropogenic activity [10–13].
The objective of the present study is to analyze the spatio-temporal dynamics of pH and Alk in the Sea of Azov waters (from the Don mouth to the Kerch Strait inclusively) for the period 1950–2020. The analysis is based on a database of hydrological and hydrochemical indicators collected at the SSC of RAS.
Materials and methods
The present study is based on the Sea of Azov oceanographic database for the period 1924–2020 [14, 15]. Coastal stations (up to 1 m depth) performed by the SSC of RAS were excluded from the analysis.
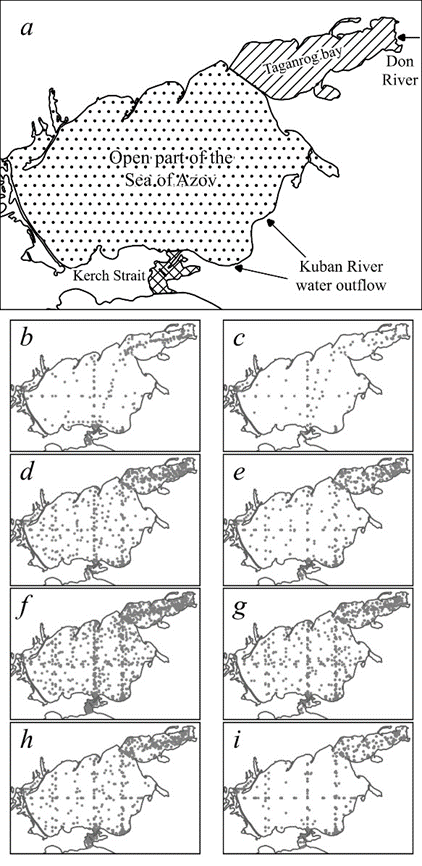
F i g. 1. Study area (a) and seasonal distribution of a number of hydrological stations for measuring pH (b, d, f, h) and Alk (c, e, g, i) in winter (b, c), spring (d, e), summer (f, g) and autumn (h, i)
The total number of oceanographic stations at which pH or Alk were determined between 1950 and 2020 exceeds 14,000, and the number of stations that carried out synchronous measurements of both indicators is more than 8,000. The studies covered the entire water area of the Sea of Azov, with the most detailed investigations focused on the Taganrog Bay and the Kerch Strait (Fig. 1).
With regard to the number of stations, the 1970s represented the period with the most data, while the 1950s and 1990s had the least (Fig. 2). In general, for the sea, the 1960s and 1970s were the decades in which the majority of stations with Alk measurements were located. Other decades are characterised by a higher prevalence of stations equipped with pH measurements.
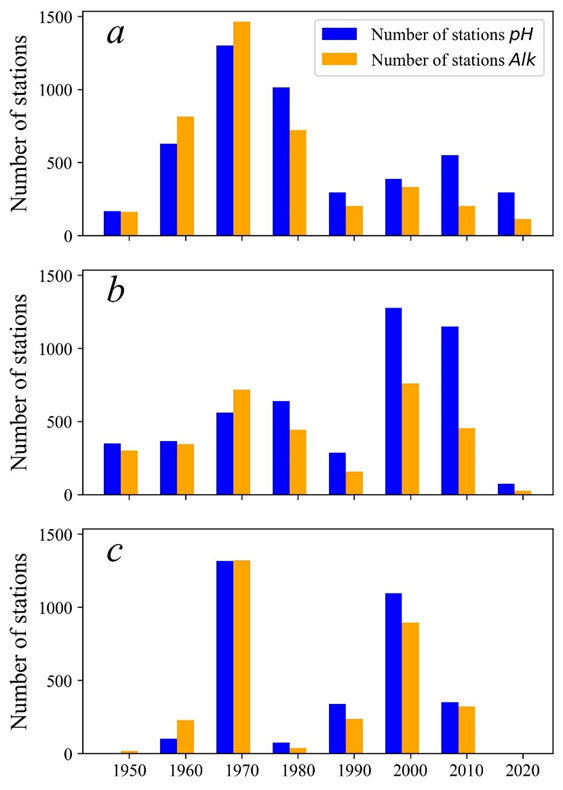
F i g. 2. Number of stations for measuring pH and Alk in the Taganrog Bay (a), the Sea of Azov (b) and the Kerch Strait (c) by decades
An analysis of the intra-annual distribution of the number of hydrological stations with pH and Alk measurements is presented in [9]. It is noted that not all stations possess a vertical distribution of the parameters under study, consequently, this paper examined data on the surface layer.
Until now, it has been problematic to track long-term changes in pH and Alk in the Sea of Azov. However, the database of hydrochemical indicators prepared at the SSC of RAS facilitates the analysis of these changes based on numerous sources, including a published analysis of long-term changes in the temperature and salinity of the Sea of Azov waters [10]. The data underwent differentiation, leading to the identification of trends and patterns in both the spatial (associated with the heterogeneity of the Sea of Azov waters) and temporal (long-term and seasonal changes) distribution of instrumental observation data for the period 1950–2020. The average pH and Alk values were calculated for the characteristic periods of change in temperature and salinity of the of the Sea of Azov waters identified in [10].
Results and discussion
The following areas are distinguished according to the degree of impact of river and the Black Sea waters: the Taganrog Bay, the Sea of Azov open part and the Kerch Strait (Fig. 1, a). The average long-term values of the studied quantities are calculated for these areas.
In the Taganrog Bay region, there is a notable increase in both pH and Alk values across all seasons, with the widest variations observed in the pH range (see Table). No statistically significant differences in pH values by season are observed. Previous studies have indicated that the spring season is characterized by the highest pH values in the Taganrog Bay, with a decrease towards the sea 5. In winter, a decrease in pH values in the Taganrog Bay and in the open part of the sea is observed 3. The increased pH levels observed in the Taganrog Bay during winter months attract attention in this study. This phenomenon has been previously documented in the literature 3, where the authors associated it with the processes of intensive life development at the ice edge.
Characteristics of pH and Alk in different regions of the Azov Sea by seasons
|
Region |
Winter |
Spring |
Summer |
Autumn |
Average annual value |
|
рН |
|||||
|
Taganrog Bay |
8.55 ± 0.33* |
8.55 ± 0.24 |
8.54 ± 0.24 |
8.53 ± 0.27 |
8.54 ± 0.25 |
|
Open part of the sea |
8.29 ± 0.17 |
8.33 ± 0.20 |
8.34 ± 0.22 |
8.31 ± 0.20 |
8.33 ± 0.20 |
|
Kerch Strait |
8.24 ± 0.15 |
8.30 ± 0.16 |
8.33 ± 0.17 |
8.38 ± 0.15 |
8.33 ± 0.16 |
|
Alk, mmоl/l |
|||||
|
Taganrog Bay |
3.77 ± 0.84 |
2.91 ± 0.49 |
2.88 ± 0.45 |
2.89 ± 0.46 |
2.90 ± 0.48 |
|
Open part of the sea |
2.70 ± 0.50 |
2.82 ± 0.39 |
2.69 ± 0.39 |
2.69 ±0.35 |
2.72 ± 0.39 |
|
Kerch Strait |
2.66 ± 0.32 |
2.84 ± 0.25 |
2.83 ± 0.28 |
2.95 ± 0.29 |
2.87 ± 0.29 |
* Average value ± standard deviation.
The increased mean Alk value in the specified region during winter can be attributed to the fact that most of the determinations applied in the averaging process refer to the period 2000–2010. This period is characterized by relatively higher Alk values in all areas of the Sea of Azov, although in winter, the Alk values typically decrease, a phenomenon determined by the relatively small river runoff 3, 5.
The general pattern of pH distribution in the Sea of Azov is characterized by elevated pH values in the Taganrog Bay (averaging 8.54), particularly in areas exhibiting water salinity levels of 4–6‰. However, a decline in pH values (averaging 8.33) is observed towards the open part of the sea and the Kerch Strait (Table, Fig. 3).
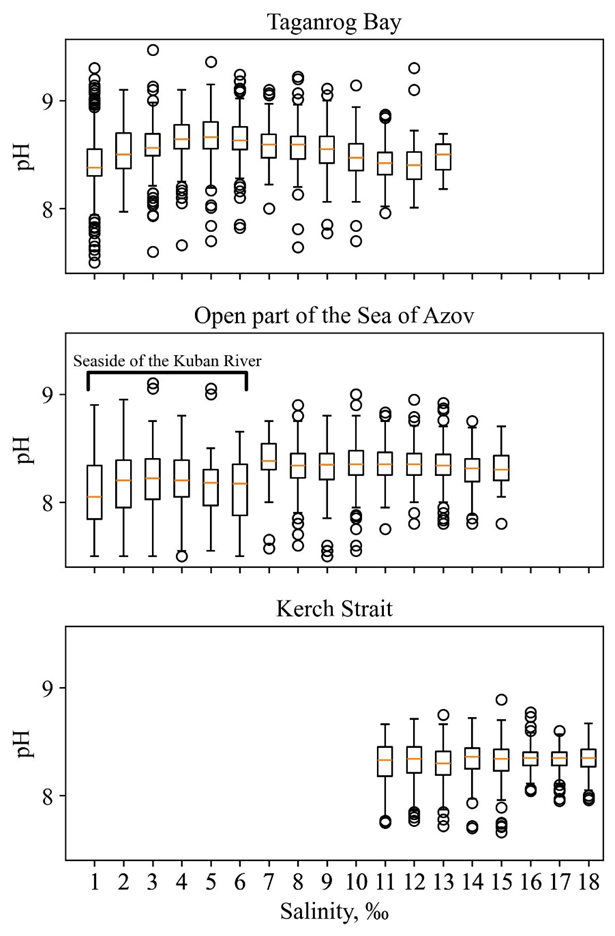
F i g. 3. Diagram of the range of pH values in the Sea of Azov and the Kerch Strait depending on water salinity
The greatest range of pH and Alk variation is observed in the zones affected by the Don and Kuban runoff, which reflects the peculiarities of the hydrochemical and hydrobiological regimes of these areas. The disturbance of carbonate equilibrium, resulting from the mixing of river and sea waters with different ionic compositions, leads to alterations in pH and Alk values. The pH value is found to be dependent on the [HCO3⁻]/[CO2] ratio, with higher values resulting in higher hydrogen indices. Photosynthesis, which consumes carbon dioxide, contributes to an increase in pH and a decrease in Alk. The elevated pH values observed in the Taganrog Bay (with the exception of the estuary section up to the 2‰ isohaline) are predominantly associated with photosynthesis, which is most active in this area compared to other areas of the sea [16]. Furthermore, the river runoff typically exhibits a lower pH value compared to the waters of the bays 3, resulting in comparatively lower pH levels in the vicinity of the Don and Kuban mouths.
In the open sea, the mean long-term pH values are distributed relatively evenly both seasonally and geographically, with a slight decrease near the Kuban mouth (by 0.15 relative to the mean pH (8.33) over the entire salinity range of this part of the sea) (Fig. 3, Table).
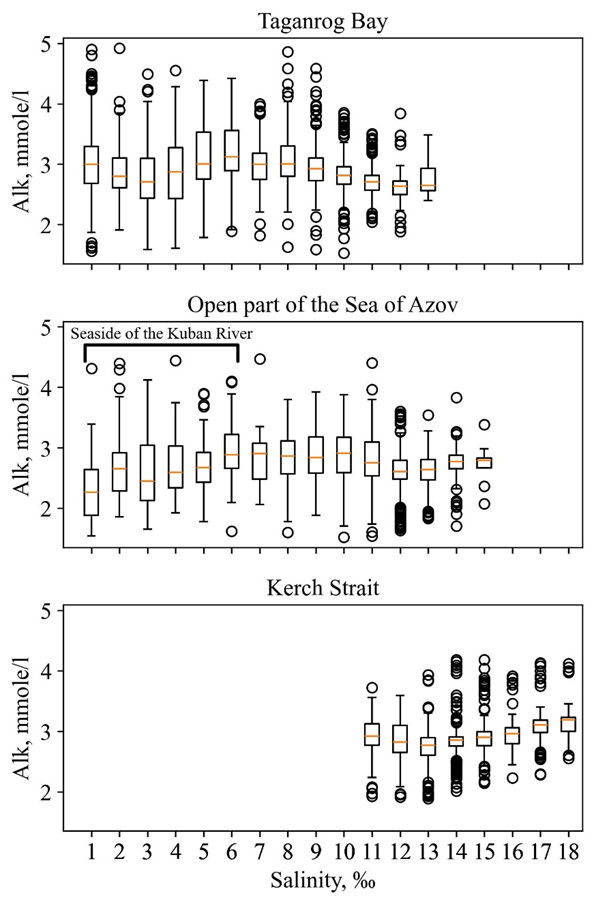
F i g. 4. Diagram of the range of Alk values in the Sea of Azov and the Kerch Strait depending on water salinity
In the southern part of the sea, pH values may be lower than in its northern part due to the possible propagation of the Black Sea waters and less intensive development of phytoplankton. However, when the waters of the Sea of Azov exit through the Kerch Strait into the Black Sea, elevated pH values may be observed due to intensive photosynthesis during the warm season (see Table).
The general pattern of Alk distribution in the Sea of Azov and the Kerch Strait consists of relatively high values in the Taganrog Bay area (see Table), especially in the areas where the water salinity is within the range of 5–8‰, with a decrease towards the open sea and then an increase in the Kerch Strait area (Fig. 4).
The alkaline-saline coefficient is indicative of the mixing of water masses of different genesis. It has been observed that the Don seaside exhibits the highest values of the coefficient, a phenomenon attributable to the presence of desalinated river waters. A decline in the coefficient’s value is evident towards the Kerch Strait and the Black Sea, regions distinguished by elevated levels of salinity (Fig. 5). The widest distribution of values for this quantity is observed in the sea areas with water salinity within the range of 1–4‰.
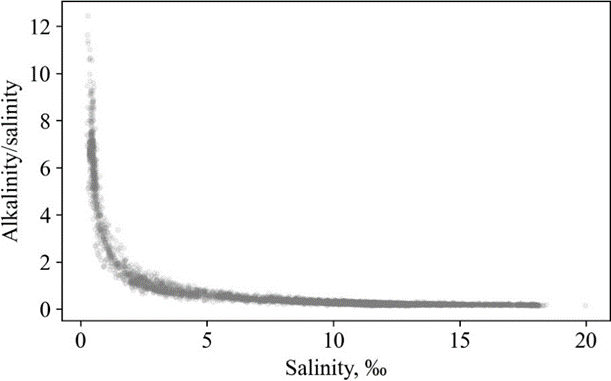
F i g. 5. Dependence of the alkaline-saline coefficient on salinity in the Sea of Azov and the Kerch Strait
The increase in alkalinity may be related to different processes in different parts of the sea. For example, increased Alk values along the Don seaside may be due to the influx of highly alkaline river waters (3.5–4 mmole/l) 5; near the coast in the winter-spring period – due to the runoff of carbonate-enriched meltwater caused by the erosion of limestone; in the southern part of the open sea and the Kerch Strait – due to the influx of the Black Sea waters with the highest salinity.
In the eastern part of the Taganrog Bay, which is affected by the Don runoff, the alkalinity values can vary widely due to a combination of physical, chemical and biological processes that are directed in different ways and occur at different times. The observed variations in alkalinity depend mainly on the inflow of Don water and the influx of carbonates into the river, the saturation of water with calcium and hydrocarbonate ions (supersaturation of water with these ions), and factors that disrupt carbonate equilibrium (changes in temperature and biota activity).
In water with salinity levels ranging from 1.5 to 5‰, the processes of coagulation of the suspension pelitic component and the formation of chemogenic calcite are observed to be most intense. A significant range of sorption phenomena and two oppositely directed processes of adsorption and desorption are observed in the pre-estuary areas [17]. This indicates primarily the presence of an unbalanced physical and chemical system in the transition zone.
An analysis of alkalinity values in the Don estuary and the Taganrog Bay revealed different types of dependence between Alk and salinity S in this area. The first type, which is the most common, is characterized by the curve Alk = f(S) turning convex downwards at low salinity values. In contrast, the second type is characterized by a curve Alk = f(S) that is convex upwards across the entire salinity range of the Taganrog Bay.
In the first case, from the mouth of the Don River towards the Taganrog Bay, the Alk values (3 mmole/l and above) initially decrease, reaching a minimum in waters with 2–4‰ salinity. Thereafter, they increase again in the Taganrog Bay waters with salinity varying from 5 to 7‰, before decreasing again towards the open part of the Sea of Azov. This phenomenon is illustrated in Fig. 4, which is a generalization of long-term data. In the second case (rarely), relatively low Alk values (less than 3 mmole/l) can increase, reaching an average of ~ 3 mmole/l and more in waters with 2.5–7‰ salinity, then decrease again towards the central part of the sea (waters of ~ 11–13‰ salinity). In addition to these two types, cases of a monotonous decrease in alkalinity depending on the salinity throughout the Taganrog Bay can be noted.
The most typical situation of decreasing Alk values in the estuary region in the Taganrog Bay eastern part in the waters of 2–4‰ salinity is associated with a carbonate equilibrium shift, the transition of carbonates into a solid phase (suspended chemogenic calcite) from the waters supersaturated with calcium and hydrocarbonate ions 3, 10 [17]. Aside from the cause mentioned above, such a decrease in Alk values in the specified salinity range may be associated with CO2 removal during photosynthesis (as a result of this process, the concentration of hydrocarbonates decreases and the pH increases). The extraction of carbonates from water by plankton, with a partial transition of carbonate-containing detritus into bottom sediments (in this case, the alkaline-saline coefficient decreases), and a temperature increase at which the carbonate equilibrium shifts towards an increase in the concentration of carbonates and a decrease in the concentration of hydrocarbonates and CO2. All these factors should be given full consideration when analyzing the behavior of the carbonate system in the Taganrog Bay, a subject which requires further research (for example, analysis of oxygen dynamics and production processes, water saturation with calcium ions and hydrocarbonates, etc.).
In publication 10, the authors demonstrated similar types of dependence in the Taganrog Bay region between the concentrations of calcium and chlorine ions. The occurrence of dissolution of solid phases of calcium carbonates is indicated by a convex upward turn in the curve Ca2+ = f(Cl⁻). In a subsequent study [17], Yu. P. Khrustalev reports that such a phenomenon is rarely observed in the Taganrog Bay and mainly in its central part. In another typical case, when the curve Ca2+ = f(Cl⁻) turns convex downward, usually at low concentrations of chlorine ions, chemogenic CaCO3 sedimentation is possible. The authors of the work 10 noted that such a dependence is clearly manifested at the bay head when river and sea waters mix and confirmed by the presence of needle-shaped calcite of chemogenic origin. In the western, seaward part of the Taganrog Bay, the authors of the abovementioned work identified a second zone of calcium carbonate sedimentation where the Taganrog Bay and the Sea of Azov waters mix. It should be borne in mind that carbonate sedimentation can lead to a decrease in the alkalinity transported to the open part of the sea during the spring phase of production processes development.
The dynamics of pH (and other parameters of the carbonate system) in the shallow Sea of Azov are challenging to predict due to the influence of numerous factors, including changes in the catchment area (the amount of precipitation, weathering, liming, the input volume of biogenic and organic substances), as well as the timing and scale of the processes of organic matter production/oxidation. Nevertheless, based on a large amount of instrumental observation data over an extended period, it becomes possible to trace the main trends and patterns of hydrogen index variations.
The pH levels in the Taganrog Bay have exhibited a marked increase during the summer and autumn months, as evidenced by the data collected from 1950 to 2020. Conversely, the highest recorded values in spring were observed during the period of 1972–1978 (average for the period – 8.60), which was characterized by a low-water regime and an increase in water salinity (from an average of 11.5‰ for 1950–1971 to 12.9‰ for 1972–1978 [10]). This increase in salinity was also evident in the subsequent period of 2011–2020 (average for the period – 8.57), which was characterized by a prolonged low-water level period, accompanied by relatively higher water temperatures (Fig. 6). Despite the low-water regime of the two indicated periods, photosynthesis processes were most likely of great importance in the Taganrog Bay and served as the cause of a relative pH increase. On the contrary, during periods of low water and increasing sea salinity, the production of organic matter decreased and the average pH values decreased. This is clearly seen in the spring and autumn of 1972–1978, as well as in the spring of 2011–2020. The lack of pH increase in summer for both low-water periods and in autumn for the second period may be associated with a recent shift of the maximum peak of primary production in the sea to the summer-autumn period [16], which requires further research.
The importance of salinity as a factor leading to a decrease in the value of organic matter primary production in the Sea of Azov was initially noted in the 1970s and later confirmed by modern studies [18, 19]. During salinization periods, the average level of organic matter primary production of organic matter by phytoplankton was low, and the highest primary production was observed during freshening periods. The main explanation for the observed dependence is the change in phytoplankton taxonomic groups when primary production decreases in the open part of the sea with a decrease in the blue-green algae biomass [18].
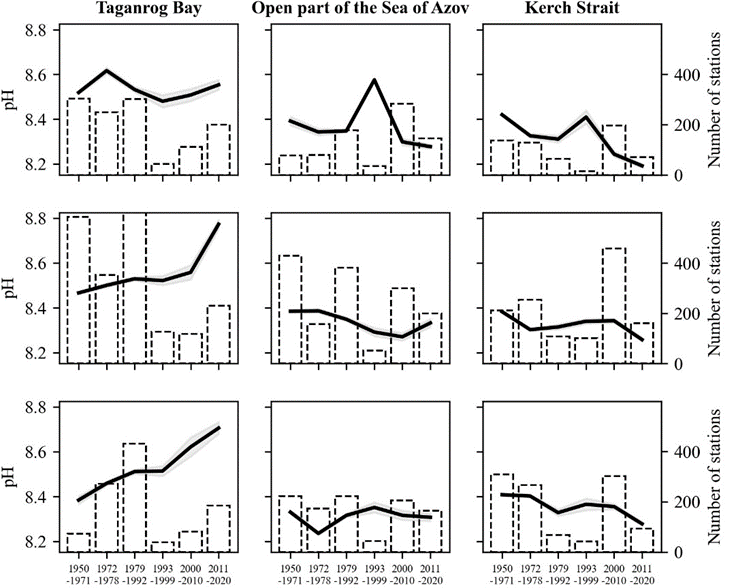
F i g. 6. Spatial-temporal changes in pH in the Sea of Azov and the Kerch Strait by seasons: a – spring, b – summer and c – autumn
The period 1993–1999 was characterized by the highest average river runoff, relatively lower salinity and water temperature [10]. During this period, a slight increase in the average pH value in the sea was noted in spring (maximum) and autumn (Fig. 6). Of particular interest is the observation that in the Taganrog Bay during the spring period, the average pH value remained unchanged in comparison to adjacent periods, suggesting that the processes of organic matter production were not strongly developed. At the same time, in the open sea, the pH values were the highest compared to other periods, a phenomenon that can be explained by the inflow of a greater volume of the Taganrog Bay waters with a higher pH, as well as, potentially, active photosynthesis. During summer, the intensity of production processes somewhat decreased.
The Kerch Strait and the sea itself are characterized by similar trends in the average pH value variation in spring and summer over the entire observation period. However, in autumn, the observed changes differ, particularly during the last low-water period (2007–2020), which may be associated with relatively less active production processes in this area due to salinization.
The mean values of total alkalinity demonstrate a predominantly unidirectional change across seasons within the specified areas (Fig. 7). In the Taganrog Bay area, a decrease in the average Alk values was observed during the low-water period of 1972–1978 compared to previous years, followed by a steady increase until the last period of 2011–2020, which is also characterized by a significant reduction in river runoff (Fig. 7). In the open part of the Sea of Azov, as well as in the Kerch Strait, there was an increase in average alkalinity values during the salinization period of 1972–1978, with the highest increases observed in the autumn and summer months, compared to spring. This phenomenon can be attributed to the possible penetration of more saline Black Sea waters with increased alkalinity (averaging 3.3 mmole/l in the surface (100 m) layer [20, 21]).
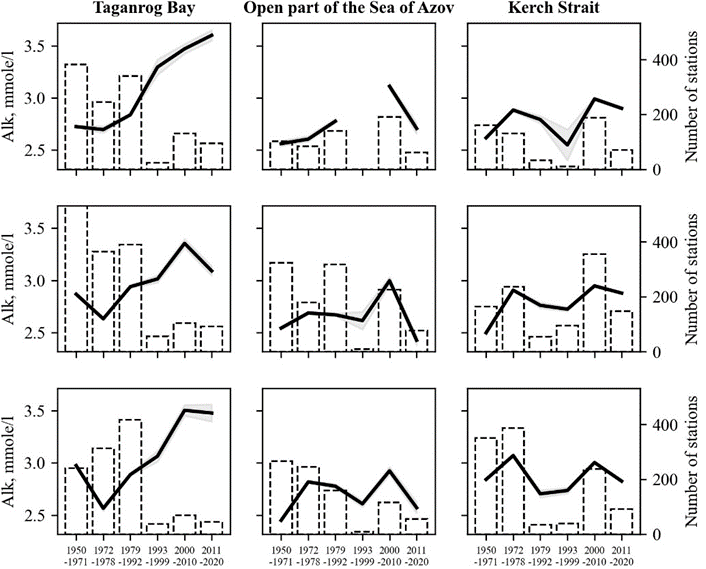
F i g. 7. Spatial-temporal changes in Alk in the Sea of Azov and the Kerch Strait by seasons: a – spring, b – summer and c – autumn
A significant increase in Alk has been observed in all areas of the sea since the early 2000s, with the sea salinity remaining relatively low during this time (the average value for the sea is 10.2‰) and the water temperature has increased significantly (on average by more than 1 °C) compared to previous periods. During the 2011–2020 low-water period, characterized by elevated salinity levels and relatively high water temperatures, no further increase in alkalinity was observed; on the contrary, a decrease in its average values was noted in all areas. There is probably a limit to the increase in this parameter under the new conditions. During the period of reduced river runoff into the Sea of Azov, the influx of Black Sea waters no longer significantly affected the average Alk value.
It can thus be stated that at the end of the 20th – beginning of the 21st centuries, not only the hydrological regime documented in the work [10], but also the hydrochemical state of the Sea of Azov changed. The underlying causes of these observed trends in total alkalinity variation still need to be clarified by identifying relationships with such factors as river runoff, water temperature and salinity, organic matter production and destruction, as well as by comprehensively examining the behavioral features of the Azov Sea carbonate system.
Conclusion
An analysis of spatio-temporal changes in the pH and Alk of the Sea of Azov and the Kerch Strait waters was performed for the period 1950–2020. The analysis was based on a database of hydrological and hydrochemical indicators collected at the Southern Scientific Center of RAS. The calculation of average values for the parameters under study was conducted on a seasonal basis for three distinct areas: the Taganrog Bay, the open part of the Sea of Azov and the Kerch Strait.
The following observations can be made about the general patterns of distribution of the parameters under study in the Sea of Azov, depending on salinity. In the Taganrog Bay area, two zones of low total alkalinity values were identified in waters with salinity levels ranging from 2–4 and 11–13‰. These zones exhibited significant water supersaturation with calcium carbonate, thereby creating conditions conductive to chemogenic calcite formation. Furthermore, an elevated pH level was identified in waters with a salinity of 4–6‰, which corresponds to the region of maximum phytoplankton productivity.
This paper presents an analysis of long-term seasonal changes in pH and Alk of the Sea of Azov waters (from the Don mouth to the Kerch Strait inclusively). The analysis is based on previously determined periods of temperature and salinity variation of the Sea of Azov waters, which made it possible to explain the observed trends.
In the Taganrog Bay, an increase in pH was observed in the surface layer during summer and autumn months. This phenomenon can be attributed to the rise in organic matter production, coinciding with a decline in salinity from the mid-1970s onwards, and an increase in water temperature in the first decade of the 21st century.
The open part of the sea (with the exception of the autumn period) and the Kerch Strait are distinguished by a general tendency towards a decrease in pH. The 1993–1999 period is notable for its desalination of the Sea of Azov, attributable to comparatively elevated river runoff, which resulted in elevated pH values in spring, as compared to previous and subsequent periods. No pronounced trend in the variation of average pH values in the open sea during autumn has been identified.
The general pattern of Alk distribution in the Sea of Azov and the Kerch Strait consists of relatively increased values in the Taganrog Bay, especially in the waters with 5–8‰ salinity, with a decrease towards the open sea and then an increase towards the Kerch Strait.
The average value of total alkalinity in the Taganrog Bay exhibited a tendency to decrease during the low-water periods of 1972–1978 and 2011–2020, despite the overall positive growth observed. At the same time, the Alk values increased in the open sea and the Kerch Strait during the initial period compared to the previous and subsequent periods, which is most likely due to the influx of more alkaline Black Sea waters. A positive trend was not observed in the latter period, as total alkalinity values were already elevated compared to those recorded prior to the 2000s. A significant increase in the average Alk values occurred during the period of rising average water temperature in the Sea of Azov in the early 20th century. During the last period of low river water levels and increased salinity of the Sea of Azov (2011–2020), a total alkalinity rise, as well as pH, was not observed in the majority of the cases examined.
It is evident that the standard deviation and scatter of the values of the parameters under study have increased since the 1990s. A notable observation is the contrasting behavior exhibited by the parameters during the low-water periods of 1972–1978 and 2011–2020. This phenomenon is most likely explained by differences in the average temperature of the water mass and shifts in the seasonal temperature variation.
At the end of the 20th – beginning of the 21st centuries, changes in the Sea of Azov hydrochemical regime occurred, which have yet to be studied in detail. The present study is the basis for a comprehensive analysis of the carbonate system and the production-destruction processes within the Sea of Azov.
1. Millero, F.J., 2007. The Marine Inorganic Carbon Cycle. Chemical Reviews, 107(2), pp. 308-341. https://doi.org/10.1021/cr0503557
2. Cai, W.-J. and Wang, Y., 1998. The Chemistry, Fluxes, and Sources of Carbon Dioxide in the Estuarine Waters of the Satilla and Altamaha Rivers, Georgia. Limnology and Oceanography, 43(4), pp. 657-668. http://doi.org/10.4319/lo.1998.43.4.0657
3. Álvarez, M., Sanleón-Bartolomé, H., Tanhua, T., Mintrop, L., Luchetta, A., Cantoni, C., Schroeder, K. and Civitarese, G., 2014. The CO2 System in the Mediterranean Sea: A Basin Wide Perspective. Ocean Science, 10(1), pp. 69-92. http://doi.org/10.5194/os-10-69-2014
4. Copin-Montégut, C., 1993. Alkalinity and Carbon Budgets in the Mediterranean Sea. Global Biogeochemical Cycles, 7(4), pp. 915-925. http://doi.org/10.1029/93gb01826
5. Orekhova, N.A., Medvedev, E.V. and Konovalov, S.K., 2016. Carbonate System Characteristics of the Sevastopol Bay Waters in 2009–2015. Physical Oceanography, (3), pp. 36-46. http://doi.org/10.22449/1573-160X-2016-3-36-46
6. Makkaveev, P.N., Polukhin, A.A., Kostyleva, A.V., Protsenko, E.A., Stepanova, S.V. and Yakubov, S.K., 2017. Hydrochemical Features of the Kara Sea Aquatic Area in Summer 2015. Oceanology, 57(1), pp. 48-57. http://doi.org/10.1134/S0001437017010088
7. St-Laurent, P., Friedrichs, M.A.M., Najjar, R.G., Shadwick, E.H., Tian, H. and Yao, Y., 2020. Relative Impacts of Global Changes and Regional Watershed Changes on the Inorganic Carbon Balance of the Chesapeake Bay. Biogeosciences, 17(14), pp. 3779-3796. https://doi.org/10.5194/bg-17-3779-2020
8. Moiseenko, O.G., Konovalov, S.K. and Kozlovskaya, O.N., 2010. Intraannual and Long-Term Variations of the Carbonate System of the Aerobic Zone in the Black Sea. Physical Oceanography, 20(6), pp. 435-450. https://doi.org/10.1007/s11110-011-9097-3
9. Sorokina, V.V. and Kulygin, V.V., 2023. Database of Hydrochemical Indicators of the Sea of Azov: Ph and Total Alkalinity. Ecology. Economy. Informatics. System Analysis and Mathematical Modeling of Ecological and Economic Systems, 1(8), pp. 110-115. https://doi.org/10.23885/2500-395H-2023-1-8-110-115 (in Russian).
10. Berdnikov, S.V., Dashkevich, L.V. and Kulygin, V.V., 2022. A New State in the Hydrological Regime of the Sea of Azov in the 21st Century. Doklady Earth Sciences, 503(1), pp. 123-128. https://doi.org/10.1134/S1028334X22030059
11. Sorokina, V.V., 2020. Current Challenges of the Carbon Cycle Research in the Sea of Azov. Ecology. Economy. Informatics. System Analysis and Mathematical Modeling of Ecological and Economic Systems, 1(5), pp. 185-191. https://doi.org/10.23885/2500-395X-2020-1-5-185-191 (in Russian).
12. Sorokina, V.V. and Berdnikov, S.V., 2008. Mathematical Modeling of the Terrigenous Sedimentation in the Sea of Azov. Oceanology, 48(3), pp. 418-427. https://doi.org/10.1134/S0001437008030144
13. Matishov, G.G., ed., 2020. The Sea of Azov: Oceanography, Physical Geography, and Hydrobiology (in Scientific Works of Academician RAS G.G. Matishov). Rostov-on-Don: SSC RAS Publishing. Vol. II (2018–2020), 448 p. (in Russian).
14. Matishov, G.G., Sherman, K. and Levitus, S., eds., 2014. Atlas of Climatic Changes in Nine Large Marine Ecosystems of the Northern Hemisphere (1827–2013). NOAA Atlas NESDIS 78. Washington, D.C.: U.S. Government Printing Office, 131 p. http://doi.org/10.7289/V5Q52MK5
15. Matishov, G.G. and Stepanyan, O.V., 2018. Research Vessel Deneb: 10 Years of Marine Scientific Research. Physical Oceanography, 25(6), pp. 501-508. https://doi.org/10.22449/1573-160X-2018-6-501-508
16. Saprygin, V.V., Berdnikov, S.V., Kulygin, V.V., Dashkevich, L.V. and Mestetskiy, L.M., 2018. Spatial Distribution and Seasonal Dynamics of the Chlorophyll a Concentration in the Sea of Azov Based on Meris Images. Oceanology, 58(5), pp. 689-699. https://doi.org/10.1134/S0001437018050132
17. Khrustalev, Yu.P., 1999. The Fundamental Problems of the Sedimentogenesis Geochemistry in the Azov Sea. Apatity: MMBI KSC RAS, 247 p. (in Russian).
18. Kosenko, Ju.V., Barabashin, T.O. and Baskakova, T.E., 2017. Dynamics of Hydrochemical Characteristics of the Sea of Azov in Modern Period of Salinization. Bulletin of Higher Educational Institutions. North Caucasus Region. Natural Sciences, (3-1), pp. 76-82. https://doi.org/10.23683/0321-3005-2017-3-1-76-82 (in Russian).
19. Kosenko, Yu.V., Baskakova, T.E., Zhukova, S.V., Barabashin, T.O. and Piatinskii, M.M., 2023. The Influence of Water Salinity on Generation of Near-Bottom Hypoxic Phenomena and the Level of Primary Production of Organic Matter in the Taganrog Bay. Aquatic Bioresources & Environment, 6(1), pp. 34-47. https://doi.org/10.47921/2619-1024_2023_6_1_34 (in Russian).
20. Kondratev, S.I., Medvedev, E.V. and Konovalov, S.K., 2017. Total Alkalinity and Ph in the Black Sea Waters in 2010–2011. Physical Oceanography, (4), pp. 35-45. https://doi.org/10.22449/1573-160X-2017-4-35-45
21. Goyet, C., Bradshaw, A.L. and Brewer, P.G., 1991. The Carbonate System in the Black Sea. Deep Sea Research Part A. Oceanographic Research Papers, 38(2), pp. S1049-S1068. https://doi.org/10.1016/S0198-0149(10)80023-8