


Russian Federation
Russian Federation
Russian Federation
Russian Federation
Russian Federation
Russian Federation
Russian Federation
Purpose. The purpose of the study is to monitor climatic changes in the southern part of Primorsky Krai related to the variations in meteorological parameters, greenhouse gas flows, and the effect of catastrophic deformation processes of the Earth's crust. Methods and Results. At the Cape Shultz Marine Experimental Station, complex measurements are continuously performed by a stationary hardware and software measuring complex for gas-deformation monitoring. The measuring complex consisting of several laser interference measuring devices (laser strainmeters, laser nanobarograph and laser meter of hydrosphere pressure variations) and a stationary closed-type gas analyzer for measuring the carbon dioxide and water vapor concentrations in the atmosphere, is briefly described. All the field measurement data obtained using the complex are assembled in a common database for subsequent research. During the measurements performed in winter 2023–2024 and spring 2024, new data on the manifestations and interactions of different geospheric processes were obtained. In winter, an excess of carbon dioxide content in the atmosphere and its decrease in early spring were recorded, that was due to a seasonal change of the prevailing wind direction. The monitoring has resulted in revealing a daily frequency of the carbon dioxide concentration. At the same time, the effect of daily variations in the atmospheric air temperature upon the daily variations in carbon dioxide concentration was recorded. The deformation monitoring made it possible to record a catastrophic earthquake which caused a tsunami in the Sea of Japan. Calculation of the magnitude of the revealed deformation anomaly of the earthquake permitted to determine the magnitude of the Earth’s crust displacement that led to the occurrence of a tsunami wave. Complex processing of data shows the data correlation induced by micro-deformations the Earth’s crust and the variations in atmospheric pressure, carbon dioxide and water vapor in the atmosphere at tidal harmonics. Conclusions. Comprehensive monitoring of the greenhouse gas concentrations and the variations in crustal deformations made it possible to identify the dependencies of short-period oscillations during the gas-deformation inter-geospheric interactions. The latest data on the changes in greenhouse gas concentrations in winter in the southern part of Primorsky Krai have been obtained.
hardware and software complex, deformation of the Earth's crust, carbon dioxide, water vapor, gas-geochemical monitoring, meteorological monitoring, deformation monitoring, tsunami
Introduction
In recent years, humanity has been monitoring global climate change with growing unease, which is particularly evident in observable meteorological parameters such as greenhouse gases, surface air temperature, precipitation, general atmospheric circulation, state of the land and the World Ocean cryospheres, and climate extremes.
Atmospheric concentrations of three greenhouse gases, from both natural and anthropogenic sources, have increased significantly since the pre-industrial times: CO2 by 46%, CH4 by 157%, N2O by 22%.
As temperatures rise and the number of catastrophic processes increases, so do the volumes of natural emissions. Temperature increases due to deformation and sea wave processes can occur not only in the Earth's crust, but also in the atmosphere, as noted in [1]. The occurrence of microbaroms (gravitational sea waves) correlates with the occurrence of microseisms. Moreover, the same waves excite microseisms and microbaroms. The energy of microseisms depends on the energy of sea waves. In [2], the relationship between microseisms and specific storms was studied. Large storms significantly increase microseismic energy [3–5]. In this regard, the variation of seismic noise on a ten-year scale was studied to determine its relationship with climate variability [6]. The seismic profiling of the Peter the Great Gulf reveals extensive gas emissions associated with their accumulation in the bottom sediments of the shelf area, formed as a result of the transformation of organic matter in sedimentary deposits [7]. At the same time, a high concentration of CO2 is recorded in the bottom sediments of this water area [8]. A significant effect of the tides on the intensity and frequency of gas emissions is also noted [9].
In formulating our estimates, it is essential to consider the role of deformation processes in the Earth's crust, causing increased emissions of natural gases from the mantle and the Earth's crust into the atmosphere. As a result of complex measurements, new data on regional deformation processes and the correlation of greenhouse gas concentrations was obtained.
The objective of this study is to examine the relationship between deformation processes in the Earth's crust and the emission of natural greenhouse gases at Cape Shultz in Primorsky Krai, Russia, and on the shelf of the Sea of Japan using the developed hardware and software complex for the monitoring of gas deformation in the atmosphere – hydrosphere – lithosphere transition zone [10].
Hardware and software complex for gas deformation monitoring
The complex comprises laser interference installations for the measurement of crustal deformation and atmospheric pressure variations, stationary gas analysis equipment and a weather station. During the experiment to study the relationship between the dynamics of greenhouse gases in the shelf area of the Sea of Japan and variations in crustal deformations over a distinct period of time, the R/V Professor Gagarinsky was anchored on the shelf of the Sea of Japan at a distance of 1.8 km from the laser strainmeter location (Fig. 1).
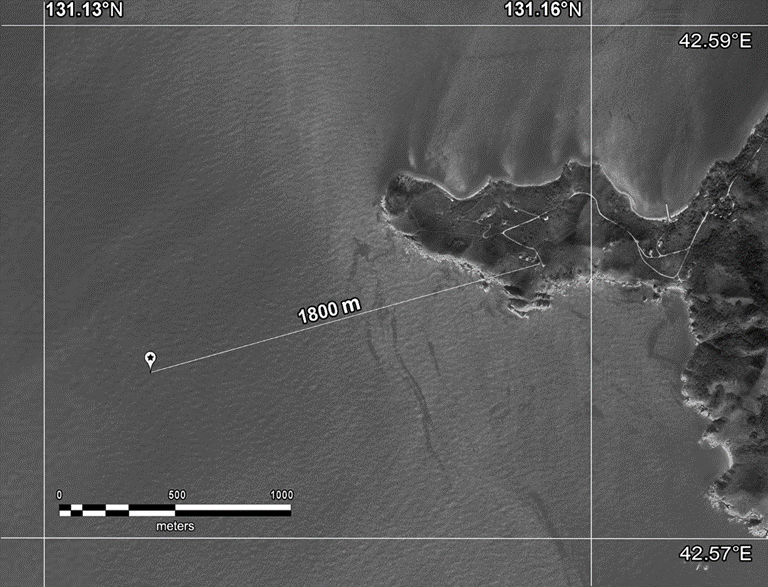
F i g. 1. The R/V Professor Gagarinsky anchoring location on the map
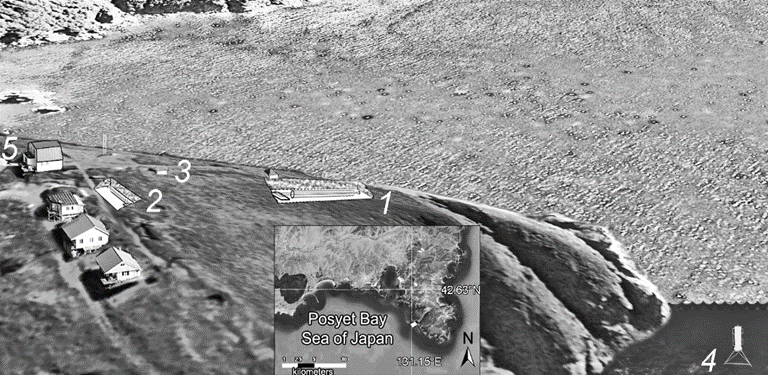
F i g. 2. Layout of laser interferometer locations: 1 – laser strainmeter with a measuring arm length 52.5 m; 2 – laser strainmeter with a measuring arm length 17.5 m; 3 – laser nanobarograph; 4 – laser meter of variations of hydrosphere pressure; 5 – laboratory
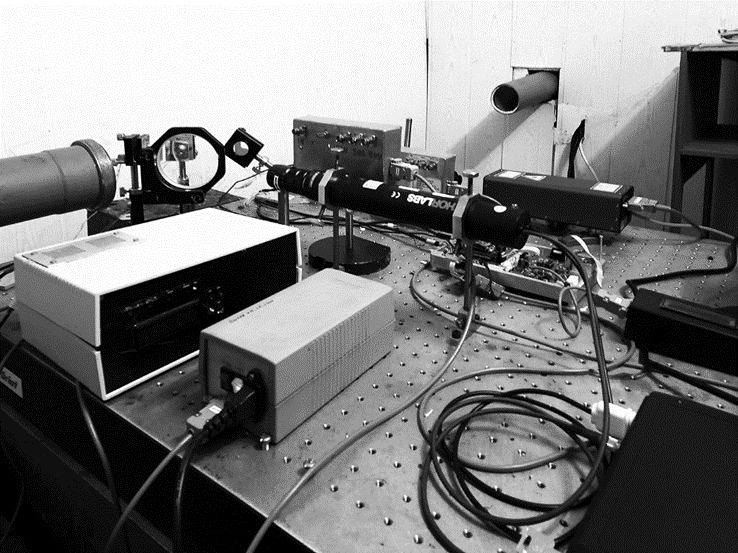
Laser interference complex. The laser interference measuring complex is situated on the Gamov Peninsula of Primorsky Krai, with its central point located at 42.58°N and 131.15°E on the territory of the Cape Shultz Marine Experimental Station (MES). The complex comprises a laser nanobarograph, laser strainmeters with measuring arm lengths of 52.5 and 17.5 m, and a laser meter to measure hydrosphere pressure variations (Fig. 2).
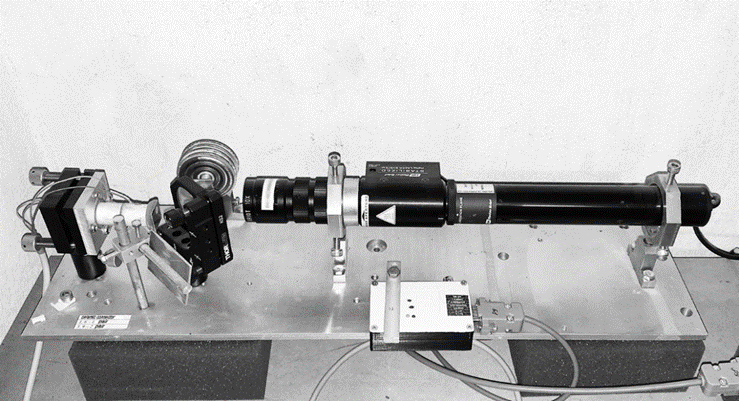
F i g. 3. General view of laser nanobarograph
The laser nanobarograph [11] was developed to study the relationships between processes occurring within the atmosphere, lithosphere and hydrosphere. It uses a block of aneroid boxes, similar to that used in traditional pointer barometric instruments, as a sensor for measuring atmospheric pressure. To increase the sensitivity when registering the movement of the unfixed end of the aneroid block, laser interference techniques are used. They are based on an equal-arm Michelson interferometer with a measuring (and “reference”) arm length of 20 cm. A frequency-stabilized helium-neon laser, manufactured by Melles Griot, is used as the radiation source, thereby ensuring frequency stability in the ninth decimal place. Figure 3 illustrates the general appearance of the laser nanobarograph. Its basic technical specifications include an operational frequency range of 0 (conditionally) to 1000 Hz and an accuracy of 1 mPa in measuring atmospheric pressure variations.
The dynamic range of all interferometers is significantly expanded by using a level reset system and a feedback system that regulate the operation of the interferometers. The two-coordinate laser strainmeter described in [12] is based on a 52.5 m and 17.5 m laser strainmeter. The optical elements of each apparatus are affixed to two granite abutments fixed to the Earth's geological formations. One of the abutments of the 52.5 m laser strainmeter is fixed to a natural granite rock formation, while the other stands on a layer of high-density loam. The height of the first abutment is ~ 1 m, while the second is ~ 3 m. All abutments are conical in shape and widen downwards. The abutments of the 17.5-meter laser strainmeter, with a height of about 1.5 m, are mounted on loam. Figure 4 shows a photo of the interference node of a 52.5 m laser strainmeter.
F i g. 4. Central interference node of the 52.5 m laser strainmeter
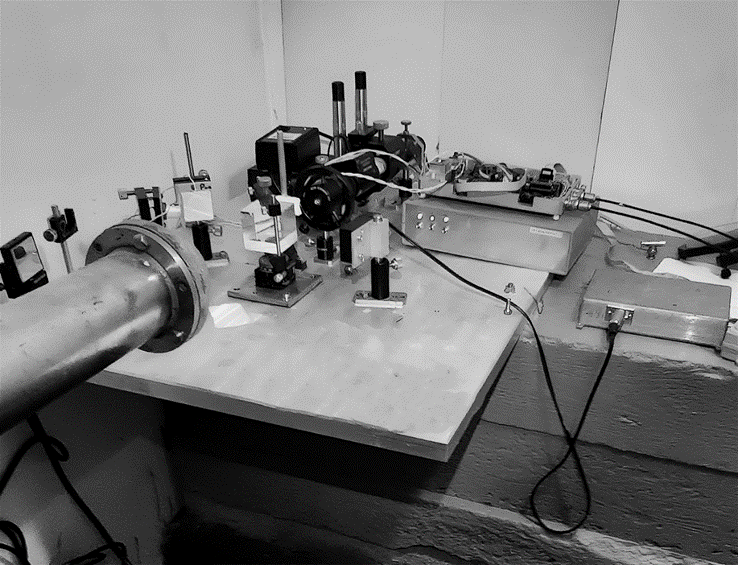
F i g. 5. Central interference node of the 17.5 m laser strainmeter
Figure 5 shows the interference node of a 17.5 m laser strainmeter. The basic technical characteristics of laser strainmeters include an operational frequency range of 0 (conditionally) to 100 Hz and an accuracy in measuring crustal displacements of 0.01 nm.
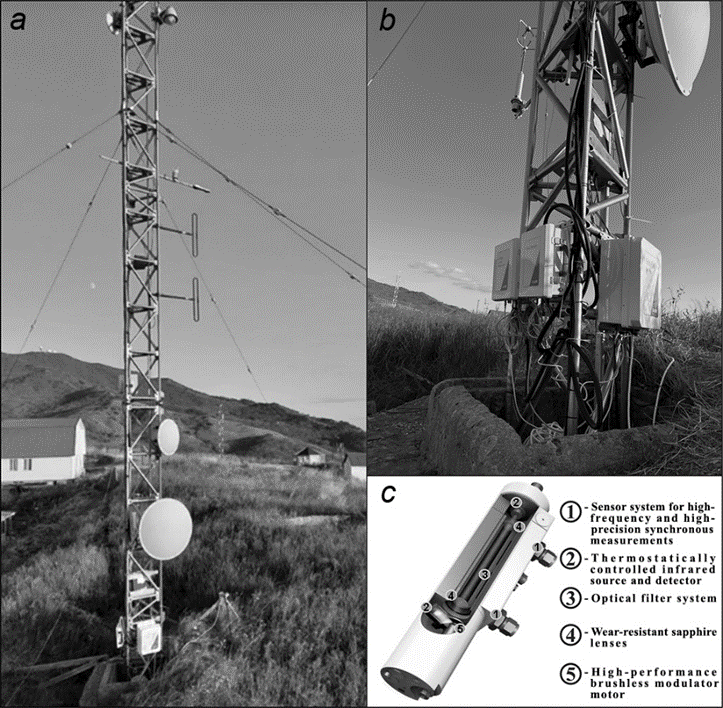
F i g. 6. Eddy Covariance station in combination with weather sensors at the Cape Shultz MES (a), closed-type CO2/H2O gas analyzer LI-7200 RS (b) and its structure diagram (c)
Stationary closed-type CO2/H2O gas analyzer LI-7200 RS. In 2023, an Eddy Covariance station based on the closed-type CO2/H2O gas analyzer LI-7200 RS, model LI-7200RSF, LI-COR, air flow module 7200-102 (Fig. 6, a), was installed at the Cape Shultz MES. The station is equipped with the SmartFlux 2 data processing system for Eddy Covariance systems in real time. The gas analyzer measurement frequency is 5–20 Hz. The CO2 measurement range is 0–3000 ppm. The sensitivity of CO2 measurements (mol H2O/mol CO2) ±0.02. The station is equipped with a high-precision digital 3-axis (3D) ultrasonic anemometer Gill Windmaster 3D for measuring turbulent flows. Its basic characteristics: sampling frequency – 20 Hz, range of measured wind speeds – 0–45 m/s, resolution – 0.01 m/s, 1.5% error (RMS) at 12 m/s, working range of wind directions – 0–359°, resolution – 0.1°, 2° error at 12 m/s, housing material – aluminum/carbon fiber. Equipment by LI-COR, closed-type CO2/H2O gas analyzer LI-7200RS is specially designed for high-speed and high-precision measurements of CO2 and water vapor concentrations in the atmosphere (Fig. 6, b). It combines the advantages of closed-type gas analyzers (high measurement accuracy, productivity, compactness and resistance to the most adverse conditions) with the low energy consumption of open-type gas analyzers.
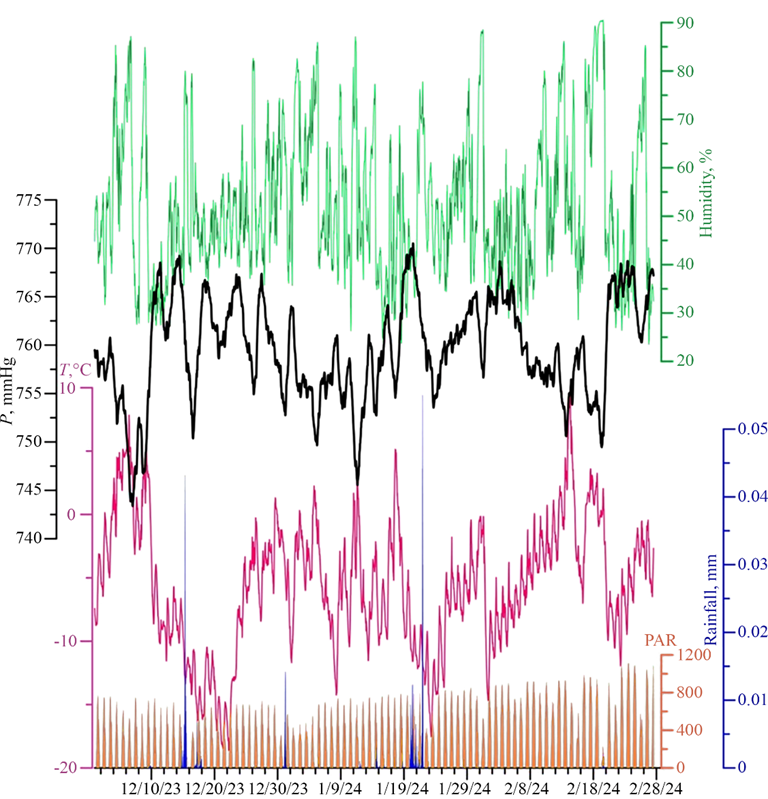
F i g. 7. Results of meteorological monitoring at Cape Schultz MES for December 2023 – February 2024. Yellow color shows photosynthetically active radiation, blue – precipitation amount, red – temperature, black – atmospheric pressure, and green – humidity
The LI-7200RS gas analyzer uses the advantages of non-dispersive infrared spectroscopy for quick and reliable CO2 density and water vapor measurement in the surrounding atmosphere. A solid-state laser diode at the base of the sensor generates infrared radiation, which passes through a system of thermally adjustable optical filters and a limited volume of the air sample and is fed to a thermally adjustable lead selenide detector (Fig. 6, c). Some of the infrared rays are absorbed by the CO2 and water vapor present in the sample space. Gas concentrations are calculated by the ratio of the absorbed IR radiation to the control value.
The obtained experimental data of the stationary gas analyzer after preliminary processing, filtration and decimation are recorded in the created experimental data base with 2 Hz sampling frequency.
Results of greenhouse gas concentration monitoring
The results of the winter monitoring of CO2 and water vapor content, conducted between 01 December 2023 and 29 February 2024, are presented in Figs. 7 and 8, along with the main meteorological parameters of the surface atmosphere. Fig. 7 presents synchronous graphs of variations in atmospheric pressure, air temperature, air humidity, precipitation and solar radiation. The monitoring data were integrated with atmospheric transport parameters to estimate the prevailing direction of atmospheric air movement in the vicinity of the monitoring station.
Upon analysis of Fig. 8, it can be concluded that during the winter season in the southern part of Primorsky Krai, the main direction of wind transfer coincides with the general circulation of the atmosphere in this period of the year. North-western and north-eastern winds prevailed (black graph in Fig. 8). These sectors generally coincide with the continental part of the Khasansky District, the internal waters of Posyet Bay and Vityaz Bay. The wind speed varied in the range of 0.5–15.1 m/s, with a mean value of 5 m/s (red graph in Fig. 8). The prevailing wind values were in the range of 5–10 m/s. The maximum values were recorded in December and January, while in February the wind patterns shifted significantly, with an increasing role of south-eastern winds and more moderate wind speed values. This is illustrated in the wind rose on the right side of Fig. 8.
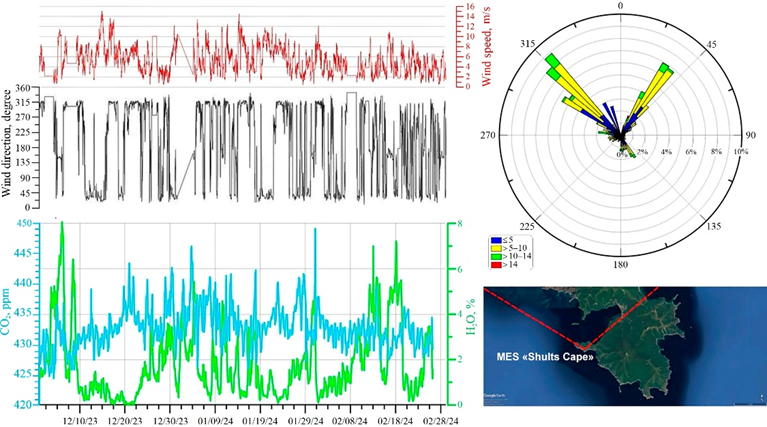
F i g. 8. Results of gas-geochemical monitoring at Cape Schultz MES for December 2023 – February 2024. Red color shows wind speed, black – wind direction, blue – concentration of carbon dioxide, and green – concentration of water vapor
The CO2 content in winter varied in the range of 424.3–449.1 ppm, with an average of 430.8 ppm (as illustrated by the blue graph in Fig. 8). The maximum average concentration of carbon dioxide was recorded in January (434.3 ppm), while the minimum was observed in February (429.2 ppm). The maximum values of water vapor concentration in the atmosphere were recorded in early December and in the second half of February (green graph in Fig. 8). According to the sea research carried out within the framework of an innovative project of national importance on the R/V Professor Gagarinsky in October – December 2022, lower values of carbon dioxide concentrations in the atmospheric surface layer were obtained for the water area of the Peter the Great Gulf , :
– on average 424 ppm (83th cruise, the Peter the Great Gulf);
– on average 425 ppm (multi-day anchorage near Cape Schultz MES, November 2022);
– on average 427 ppm (84th–85th cruises, December 2022).
The water vapor content in winter varied within 0.1–8.1%, with an average of 2.2% and a median of 2.8%. The maximum monthly mean values were recorded in February and the minimum values in December and January. It is worth noting that the peaks of both gas components often coincide, but the opposite dependence is also found.
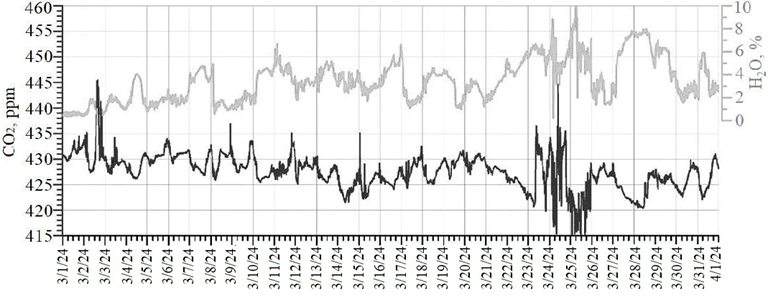
F i g. 9. Results of gas-geochemical monitoring at Cape Schultz MES for March 2024
In general, such a level of CO2 concentration vividly illustrates the increased level of its content in the atmosphere in winter. This is due both to the peculiarities of the atmospheric transfer (mainly from the continental part) and to the almost complete slowing down of photosynthesis and vegetation processes (carbon dioxide drainage is difficult) due to the low temperatures. Furthermore, from December 2023, a characteristic diurnal variability of carbon dioxide concentrations has been detected, with an increase during the day and a smooth decrease at night (with a minimum in the morning), with an average amplitude of 1.3 ppm. This appears to be related to local features of the atmospheric circulation and a change in the direction of the prevailing wind in the land-sea system.
In March 2024, the first regional data on CO2 concentrations for the spring period were obtained (Fig. 9). The carbon dioxide content in March varied in the range of 388.9–445.5 ppm, with an average of 427.5 ppm and a median of 427.8 ppm. The water vapor content varied in the range of 0.2–10.6%, with an average of 3.5% and a median of 3.3%. In general, similar diurnal dependencies are observed for this season of the year.
The spring period is characterized by the transition to the warm season with positive daytime temperatures and often negative nighttime temperatures. In addition, an important factor influencing the level of concentrations is a relatively dry winter with little snow, which, together with a constant flow of solar radiation and warming of the soil layer, causes frequent occurrence of fire-hazardous periods with the development of forest fires and grass fires in Primorsky Krai. March 2024 was extremely fire hazardous, especially for the southern part of the Khasansky District (Fig. 10).
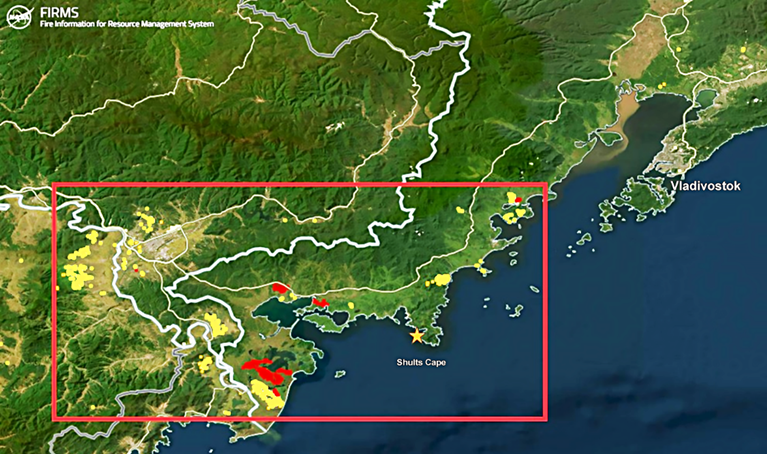
F i g. 10. Areas of distribution of temperature anomalies (fire sources) in March 2024 based on the NASA FIRMS (Fire Information for Resource Management System) data (site https://firms.modaps.eosdis.nasa.gov). Red zones are the short-term fires, light yellow ones – hotbeds of burning for more than 5 days
The main (peak) periods of the fires occurred on 1–4 March and 23–26 March 2024, which is well reflected in the peak-shaped anomalies of carbon dioxide in the surface atmosphere (see Fig. 8).
General characteristics of the distribution of greenhouse gases over four months are shown in Figs. 11 and 12.
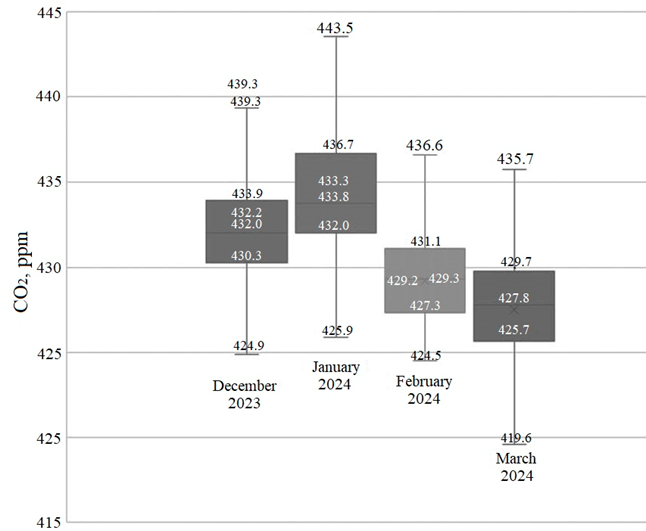
F i g. 11. Statistical estimation parameters for carbon dioxide concentrations. The boundaries of the box plot are the first and the third quartiles (25th and 75th percentiles, respectively), line in the middle of the box is the median (50th percentile). The ends of “whiskers” are the minimum and maximum observed data values; the ones exceeding these values belong to the emission category
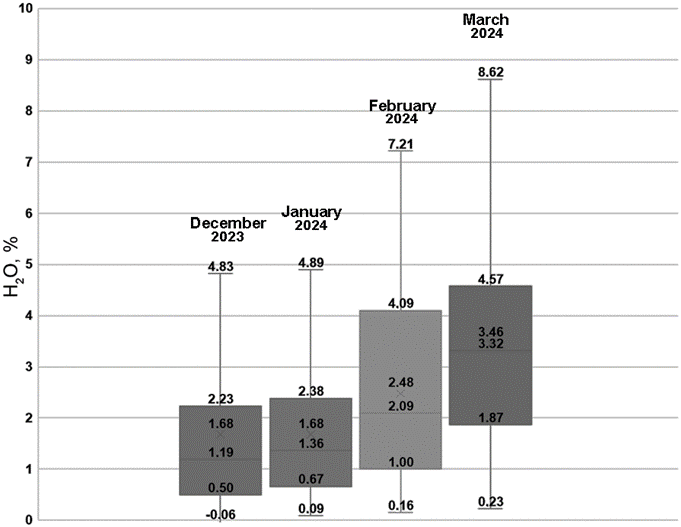
F i g. 12. Statistical estimation parameters for water vapor concentrations
In general, the statistical estimation allows for the discussion of a trend of decreasing carbon dioxide concentrations by March 2024, with a maximum occurring in the middle of the winter season (January 2024). A close relationship has been identified between the temperature regime and the manifestation of daily variability in solar activity. This may also be associated with a change in wind direction during the day/night period. This pattern may be disrupted due to adverse weather events, cyclonic activity and additional emission sources, such as forest fires and grass fires. Further modeling of atmospheric transport will help to identify potential areas – sources of carbon dioxide emissions into the atmosphere.
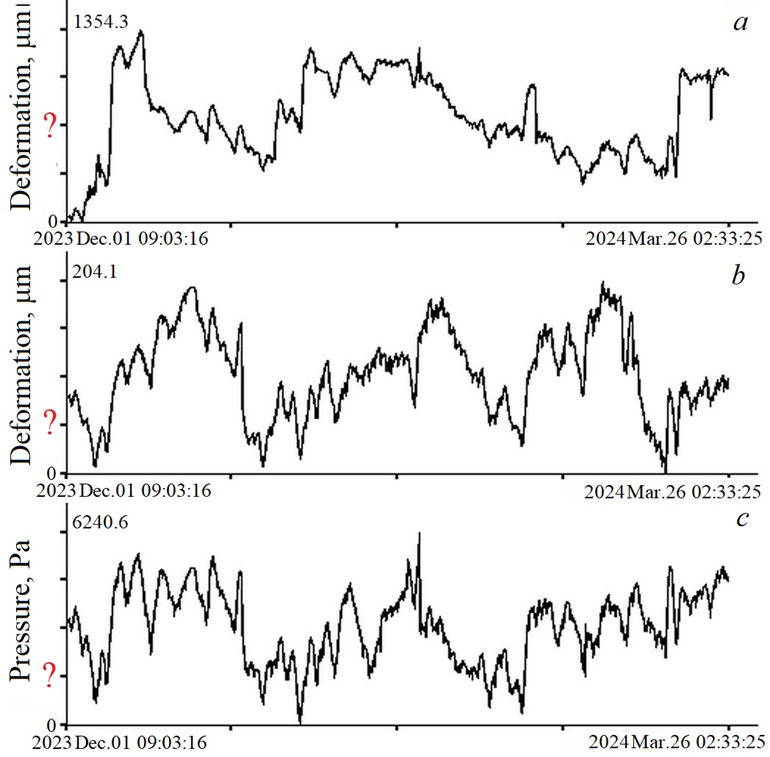
F i g. 13. Results of deformation monitoring from December 1, 2023 to March 26, 2024: records of 52.5 m (а) and 17.5 m laser (b) strainmeters, and laser nanobarograph (c)
The conducted studies have revealed the gas-geochemical background of carbon dioxide in the atmospheric air during the winter period (430.8 ppm) and at the beginning of the spring season of 2024 (427.8 ppm) in the Cape Schultz MES area. The prevailing climatic parameters of the atmosphere were recorded and the fundamental trends of change were identified.
Results of deformation monitoring
Figure 13 shows the results of deformation monitoring for the specified period of time.
The deformation and gas monitoring data for the period of 1–25 December 2023 were subjected to spectral processing using the periodogram method, with a number of averaging of 3. The data processing results given in Figs. 8 and 13 are shown in Fig. 14.
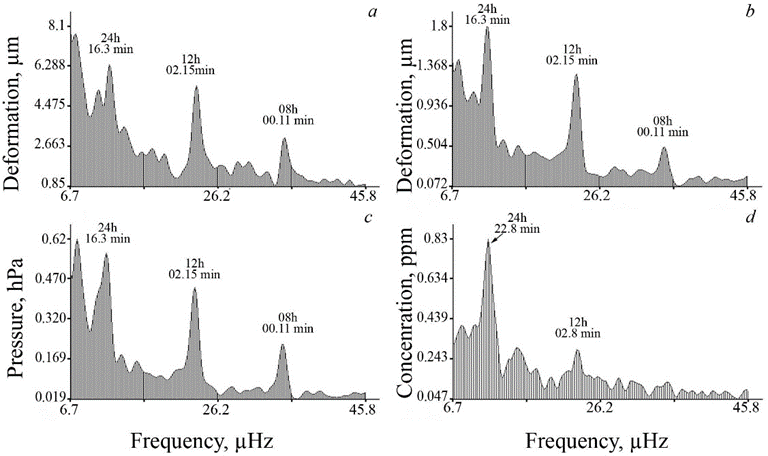
F i g. 14. Spectra obtained by processing the data from 52.5 m (a) and 17.5 m (b) laser strainmeters, laser nanobarograph (c), and СО2 gas analyzer (d) for December 2023
As can be observed, all the spectra show maxima that correspond to both diurnal and semidiurnal tides. A prominent peak with a period of ~ 8 h stands out in the spectra of the laser strainmeter and laser nanobarograph records.
A detailed examination of the synchronous records of the laser interference setups and the gas analyzer revealed the presence of tidal harmonics in the spectra (crustal deformations, variations in atmospheric pressure and carbon dioxide concentration). The correlation at these frequencies is possibly caused by the effect of tides on the sedimentary bottom rocks, which have an increased gas content.
The most remarkable (so far) outcome of the acquired data is the documentation of a tsunamigenic earthquake in the Sea of Japan by laser strainmeters, which resulted in the generation of a tsunami wave reaching up to 0.3 m in height along the Primorsky Krai coastline. Figure 15 shows records of a 52.5 m and 17.5 m laser strainmeters, which registered the earthquake and deformation anomalies (strain jumps) caused by seafloor movements at the epicenter. The earthquake occurred at the northeastern tip of the Noto Peninsula (Japan) on 1 January 2024 at 07:10:09 UTC with a magnitude of 7.6. The level of this deformation anomaly allows for the calculation of the bottom displacement that resulted in the tsunami generation. According to [13], the calculated bottom displacement based on the 52.5 m laser strainmeter recording was 5.4 m at the earthquake epicenter.
The gas analyzer records showed no similar signals associated with catastrophic earthquakes in the region.
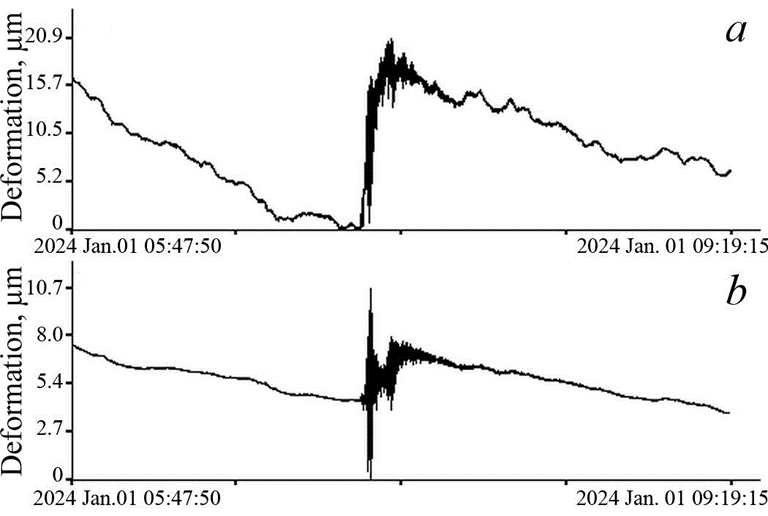
F i g. 15. Tsunamigenic earthquake and deformation anomaly on the records of 52.5 m and 17.5 m laser strainmeters
Conclusion
The measurements of carbon dioxide variations in the winter of 2023–2024 showed that the increase in CO2 levels was linked to the direction of the wind blowing from the continent. This is due both to the peculiarities of atmospheric transfer and to the almost complete slowing down of photosynthesis and vegetation processes due to low temperatures. In summer, the wind direction is almost reversed. Daily variations in CO2 concentration are exclusively associated with diurnal temperature variations.
As a result of the deformation monitoring, a tsunamigenic earthquake was registered, which generated a tsunami in the Sea of Japan. Based on the magnitude of the deformation anomaly registered by the laser strainmeter, it was possible to determine the bottom displacement in the earthquake source, which led to the tsunami generation. According to the measurements, it was ~ 5.4 m. These anomalous deformation processes did not, as expected, manifest themselves in water vapor and carbon dioxide variations at Cape Schultz.
Spectral processing of data from laser strainmeters, a laser nanobarograph and a gas analyzer revealed strong spectral components at tidal harmonics.
1. Bowman, D.C. and Lees, J.M., 2018. Upper Atmosphere Heating from Ocean-Generated Acoustic Wave Energy. Geophysical Research Letters, 45(10), pp. 5144-5150. https://doi.org/10.1029/2018GL077737
2. Gerstoft, P., Fehler, M.C. and Sabra, K.G., 2006. When Katrina hit California. Geophysical Research Letters, 33(17), L17308. https://doi.org/10.1029/2006GL027270
3. Astiz, L. and Creager, K., 1994. Geographic and Seasonal Variations of Microseismic Noise. EOS: Transactions, American Geophysical Union, 75, 419.
4. Bromirski, P., Flick, R.E. and Graham, N., 1999. Ocean Wave Height Determined from Inland Seismometer Data: Implications for Investigating Wave Climate Changes in the NE Pacific. Journal of Geophysical Research: Oceans, 104(C9), pp. 20753-20766. https://doi.org/10.1029/1999JC900156
5. Grevemeyer, I., Herber, R. and Essen, H.-H., 2000. Microseismological Evidence for a Changing Wave Climate in the Northeast Atlantic Ocean. Nature, 408(6810), pp. 349-352. https://doi.org/10.1038/35042558
6. Aster, R.C., McNamara, D.E. and Bromirski, P.D., 2008. Multidecadal Climate-Induced Variability in Microseisms. Seismological Research Letters, 79(2), pp. 194-202. https://doi.org/10.1785/gssrl.79.2.194
7. Rybalko, A.E., Scherbakov, V.A., Ivanova, V.V., Slinchenkov, V.N., Belyaev, P.Yu., Andreev, A.Yu., Tokarev, M.Yu., Maev, P.A. and Belov, M.V., 2018. [Assessment of Hazardous Geological Processes in Peter the Great Bay (Sea of Japan) According to the Geological Environment Monitoring Data]. In: N. A. Zhuravleva and K. S. Viskhadzhieva, eds., 2018. Prospects of Development of Engineering Surveys in Construction in the Russian Federation: Materials of Reports Presented on the XIV All-Russian Scientific and Practical Conference and Exhibition of Surveying Organizations. Moscow: Geomarketing LLC, pp. 592–597 (in Russian).
8. Okulov, A.K., Obzhirov, A.I., Mishukova, G.I. and Okulov, Al.K., 2017. Methane Distribution of the Water Peter Great Gulf. Underwater Investigations and Robotics, (1), pp. 68-73 (in Russian).
9. Sultan, N., Plaza-Faverola, A., Vadakkepuliyambatta, S., Buenz, S. and Knies, J., 2020. Impact of Tides and Sea-Level on Deep-Sea Arctic Methane Emissions. Nature Communications, 11(1), 5087. https://doi.org/10.1038/s41467-020-18899-3
10. Dolgikh, G., Bovsun, M., Dolgikh, S., Stepochkin, I., Chupin, V. and Yatsuk, A., 2024. Hard- and Software Controlled Complex for Gas-Strain Monitoring of Transition Zones. Sensors, 24(8), 2602. https://doi.org/10.3390/s24082602
11. Dolgikh, G.I., Dolgikh, S.G., Kovalev, S.N., Koren, I.A., Novikova, O.V., Ovcharenko, V.V., Okuntseva, O.P., Shvets, V.A., Chupin, V.A. [et al.], 2004. A Laser Nanobarograph and Its Application to the Study of Pressure-Strain Coupling. Izvestiya, Physics of the Solid Earth, 40(8), pp. 683-691.
12. Dolgikh, G.I., Kovalev, S.N., Koren, I.A. and Ovcharenko, V.V., 1998. A Two-Coordinate Laser Strainmeter. Izvestiya, Physics of the Solid Earth, 34(11), pp. 946-950.
13. Dolgikh, G. and Dolgikh, S., 2021. Deformation Anomalies Accompanying Tsunami Origination. Journal of Marine Science and Engineering, 9(10), 1144. https://doi.org/10.3390/jmse9101144