


Russian Federation
Russian Federation
Russian Federation
Russian Federation
Russian Federation
Russian Federation
Russian Federation
Russian Federation
Russian Federation
The occurrence of microplastics in the marine environment and their impact on the environ- ment, biodiversity, and human life is concerning. Pekalongan is an industrial city with vari- ous anthropogenic activities such as fisheries, aquaculture, household, and most notably the batik textile industry. This research was carried out to determine the spatial distribution and characteristics of microplastics in the water and sediment of the Pekalongan coastal area. Water samples were collected at 10 stations (at 5 of them sediments were sampled as well) in the Sengkarang River estuary and its surroundings. Microplastics were identified using the optical microscopy method, followed by Fourier transform infrared spectroscopy (FTIR) testing to determine the polymer of microplastics. Microplastics were characterized using a Motic SMZ-161 microscope, then photographed using a Moticam A5 and counted based on each characteristic. In this study, we found polymers such as polystyrene, poly- ethylene, polyamide, and polyester. The abundance of microplastics in seawater was 214.4 particles/L and 300 particles/kg in suspended sediments. The microplastics types included fibers, fragments, films, and pellets of various colors and sizes. The dominant microplastic type in seawater and sediments was fiber (44%, 44%), followed by fragments (28%, 25%), foam (15%, 13%), and pellets (7%, 16%). White was the dominant color in seawater (54%) and sediments (53%), blue (21%, 18%), and red (15%, 17%), while yel- low, green, and black were also found in small portions. The size of microplastics ranged from 1 µm to 10 mm, and the dominant size range was in the 50–250 µm group. The high- est concentration of microplastics in the seawater was found in site B5 with a concentration of 360 particles/L, while the highest concentration of microplastics in sediments was found in site B4 (389 particles/kg). Site B5 is located in the midwater area but still close to the estuary, where the pollution from the surrounding areas flows to the location. Site B4 is in the littoral-intertidal zone where the water is affected by tides and is prime location for sedimentation to occur.
microplastics, Pekalongan, North Java Coast, estuary, pollution
Introduction
Waste has been dumped into the ocean for centuries, but recently the composi- tion of marine debris has drastically changed. Most garbage used to be composed of organic biodegradable items some decades ago. Synthetic materials including plastics, are now prevalent in solid waste. Plastic is one of the major non-organic waste segments in our daily output of municipal solid waste production [1]. Bottles of plastic, ropes, tarpaulins, and synthetic fishing lines float freely, decay slowly, and break into smaller pieces [2]. As the characteristics of microplastic is buoyant and durable, they accumulate on beaches, ocean eddies, and enclosed or semi- enclosed seas where surface water is held for extended periods [3]. Plastic is highly buoyant; thus, it can be carried out for thousands of miles by currents and dispersed across the marine environment, which can be detrimental to marine ecosystems [4–6].
Microplastics are solid particles of polymer with regular or irregular shape and size between 1 μm and 5 mm. Plastic breaks down into finer particles [7–9]. Microplastics made up approximately 92% of the 5.25 trillion plastic particles pre- sent at global scale in the ocean [10–12]. Research on microplastics in the Java Sea was first conducted by Purba et al. in 2016 [13] with results of 0.2 mg/L microplas- tics detected in Java Sea water. Various human activities on land, coastal, and marine areas are the main sources of microplastics present in the Java Sea waters. It is believed that around 75–95% of plastic waste in the marine environment comes from land-based sources, and the remaining 5–25% comes from the ocean [14] like unintentional loss or illegal disposal during offshore drilling or fishing [10]. Because microplastics can be consumed by marine life, and eventually kill them, their effects on the marine biota are concerning [15]. Microplastics can also potentially reduce aquaculture’s economic benefits by causing oxidative stress in aquaculture products, altering their behaviour, growth, and reproduction, and even causing them to die [16].
Pekalongan is a coastal industrial and tourist city covering 45.25 km2 and has population of 315,997 people. The city has various anthropogenic activities in-
cluding 364 companies that process fish, with ponds and cultivation areas cover 331,292 ha; 634 batik industries, and up to 75 medium- to large-sized companies that make food, textiles, plastics, and shipyard activities (BPS Pekalongan, 2022). Due to this, the garbage produced in Pekalongan City each day approaches 140 tons, or 0.46 kg per resident (Pekalongan City, 2023). The city of Pekalongan’s indus- tries use plastic materials in their operations and output. A hazardous consequence
of microplastics in sediments and waterways is the disturbance of the ecosystem’s biotic and abiotic water ecology [17, 18]. This research was carried out to determine the spatial distribution and also to identify the abundance, shape, size, color, and polymer type of microplastics in water and suspended sediment samples in Peka- longan waters.
Materials and Methods
The research location was in Pekalongan Waters, Central Java, in the Sengka- rang River estuarine area and the surrounding waters. The purposive field sampling method was used to determine 10 sampling sites for microplastics in seawater and 5 sampling sites for sediment samples (sites B1–B4, and B9), as shown in Fig. 1. The sites were defined as such to represent the coastal environment, both on the sea- ward, estuary, and riverine areas.
Collection of samples was conducted during the dry season with three replica- tions. The upstream and downstream areas of the Sengkarang River are located within residential areas, textile industries, tourist attractions, fishing grounds, and wastewater treatment plants.
During the collection of samples, half of the 108 μm plankton net was dipped into the surface. The volume of filtered water taken was 10 m3 (the collected water discharge was calculated using a flow meter). The sediment samples were taken using a grab sampler at each location sites with a total sample of 400 grams.
Water samples were filtered using a vacuum pump and then mixed with 30% Fe (II) solution and H2O2 to remove organic matter that was still contained in the sample. The density of the microplastic in the water samples was increased by using NaCl. Each sediment sample was extracted through the process of density separation method using ZnCl2 solution (1.6 g·L−1), and the sediment-salt mixture solution was mixed with a spatula [19], HCl was used to remove organic matter that was still contained. The method of testing water and sediment samples refers to the National Oceanic and Atmospheric Administration (NOAA) method with minor adjustments 1).
Multiple measures were implemented to minimize the possibility of microplas- tics contamination during the microplastics analysis procedure. Sampling equip- ment and glassware were rinsed with purified water several times and were dried before use. There were no plastic consumables used in the process of sample col- lection and extraction. The filters, laboratory consumables, and the solvent were always covered with aluminium foil during the sample extraction procedure. Latex gloves and cotton laboratory coats were used during the microplastics sam- pling and extraction process. Sample separation was performed by filtration using
0.45 µm cellulose filter membranes. The filter paper was observed under a micro- scope using the sweeping method to see each type of microplastic. Microplastics were identified using the optical microscopy method [20]. Optical microscopy was the first method of characterization used to observe microplastics [21], followed by Fourier Transform Infrared Spectroscopy (FTIR) testing to determine the polymer of microplastics [22]. Polymer identification was done by dissolving microplastics that is already filtered, and then the solution is pipetted and placed under the FTIR.
Microplastic shape, size, and color identification was performed using a Motic SMZ-161 microscope. After that, the microplastics found were photographed using a Moticam A5 and counted based on each characteristic. Statistical data analysis was conducted on the type, size, color, number, and abundance of microplastics. The results of data analysis will be displayed in graphical form for each sample. The distribution of microplastics was visualized in the spatial map.
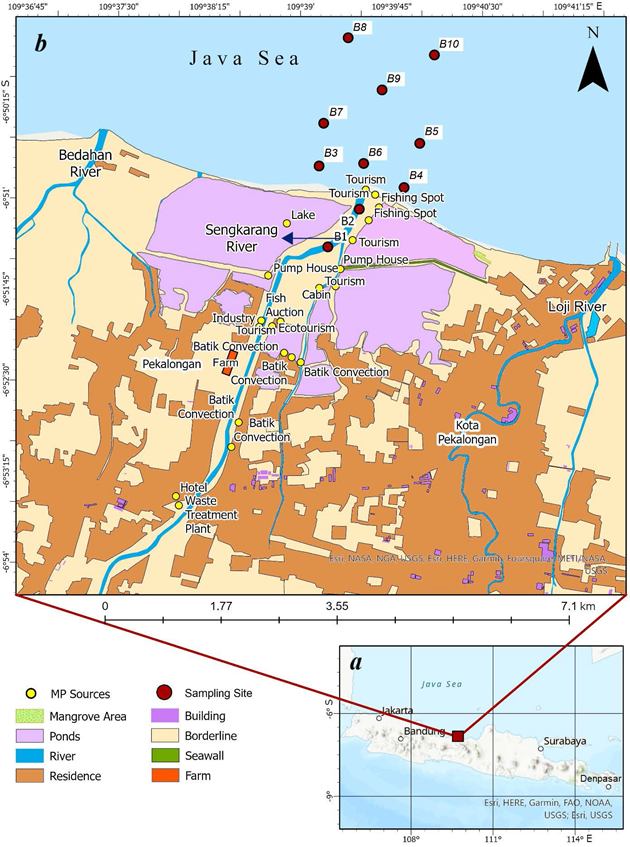
F ig . 1. Map of Java Island, the red square denotes the area of interest (a), the enlarged image of the area of interest (b)
Р и с . 1 . Карта-схема о. Ява, красным квадратом выделена исследуе- мая область (а); увеличенное изображение исследуемой области (b)
Results
The spatial abundance of microplastics in seawater and sediment in Pekalon- gan waters is shown in Fig. 2. The average abundance of MPs in seawater was
214.4 particles/L and 300 particles/kg in suspended sediment. Site B1 was located in the Sengkarang River, close to the pump house, tourist area, fish auction, and ponds. Site B2 is located in the Sengkarang estuarine area, close to the beach and fishing grounds. The littoral or intertidal area is represented by sites B3, B4 (close to the mangrove area), and B6. Sites B5 and B7, were in the middle water area, and sites B8, B9 and B10 were in deep water quite far from anthropogenic activities other than marine fishing (Table 1). The abundance of microplastics in seawater and sediment has significant differences. The abundance of MPs in sediments had higher numbers.
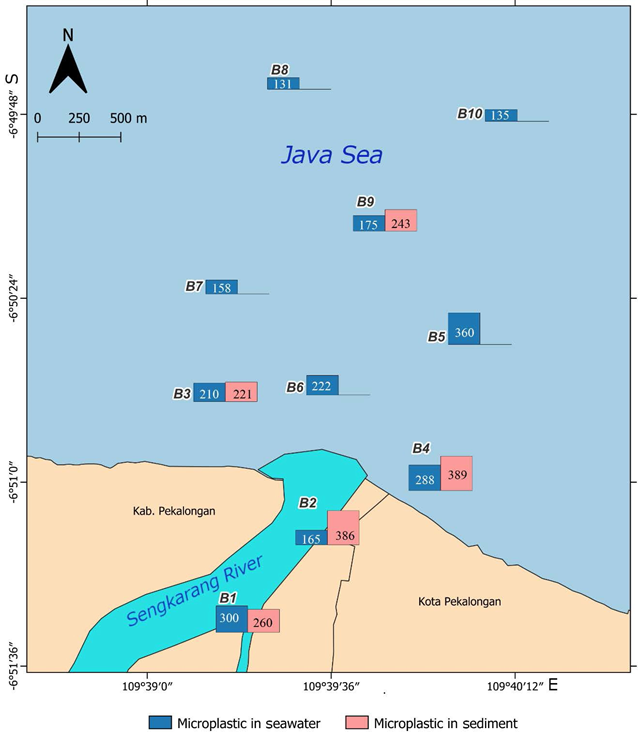
F ig . 2. Microplastics abundance in water, particle/L, and sediments, particle/kg
Р ис . 2 . Концентрация микропластика в воде, част/л, и донных отложениях, част/кг
Tab l e 1 . Abundance of microplastics in seawater, particles/L, and sediments, particles/kg, at different sampling sites
Т а б л ица 1 . Концентрация микропластика в морской воде, част/л, и донных отложениях, част/кг, на разных станциях
|
Site / Станция |
Abundance of microplastics / Концентрация микропластика |
Description of sampling location / Описание места отбора проб |
|
|
in seawater / в морской воде |
in sediments / в донных отложениях |
||
|
B1 |
300 |
260 |
Sengkarang River area, near pump |
|
house, tourism area, fish auction, ponds / |
|||
|
Район р. Сенгкаранг, рядом насосная |
|||
|
|
|
|
станция, туристическая зона, |
|
|
|
|
рыбный аукцион, пруды |
|
|
|
|
Mouth or estuarine of Sengkarang River, |
|
B2 |
165 |
386 |
tourism area, fishing spot area / Устье р. Сенгкаранг, |
|
|
|
|
туристическая зона, рыболовная зона |
|
B3 |
210 |
221 |
Near coastal area / Прибрежная зона |
|
B4 |
280 |
389 |
Near coastal area, mangrove area / Прибрежная зона, мангровые заросли |
|
B5 |
360 |
– |
Midwater water area / Зона средних глубин |
|
B6 |
220 |
– |
Near coastal area / Прибрежная зона |
|
B7 |
158 |
– |
Midwater area / Зона средних глубин |
|
B8 |
175 |
– |
Open water / Открытое море |
|
B9 |
131 |
243 |
Open water / Открытое море |
|
B10 |
135 |
– |
Open water / Открытое море |
In this research, the types of microplastics shown in Fig. 3, a were found. Fiber types were most prevalent in seawater samples (44%) and sediment samples (44%). The second most prevalent type found in Pekalongan waters was the frag- ment type, which constituted 28% of seawater samples and 25% of sediment sam- ples. In the samples, 15% of foam types were found in seawater samples and 13% in sediments. The pellet type in seawater amounted to 7%, and in sediment it amounted to 16%.
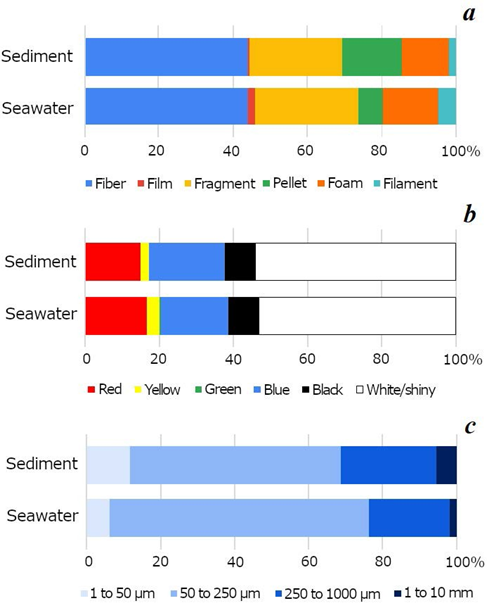
F ig . 3. Percentage of microplastics types (a), colors (b), and size (c) in seawater near Pekalongan
Р ис . 3 . Состав микропластика по типу (а), цвету (b) и размеру (с) в водной среде в районе Пекалонгана
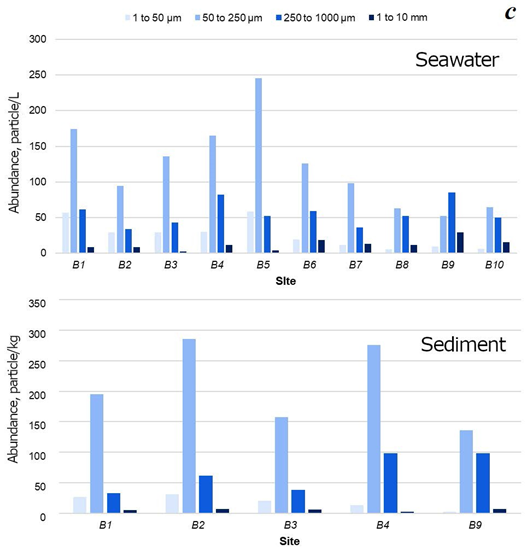
Figure 3, b shows the percentage of microplastic color in seawater and sedi- ment samples. The MPs color in seawater and sediment was dominated by white/ shiny at 54% in seawater samples and 53% in sediment samples. The second most common color was blue at 21% in water samples and 18% in sediment samples, followed by red at 15% in water samples and 17% in sediment samples. In this study, yellow and black MPs were also found, as well as green ones. The size distribution of microplastics is depicted in Fig. 3, c, where size groups include 1–50 µm, 50–250 µm, 250–1000 µm, and 1–10 mm. Microplastics between 50 and 250 µm dominated the samples with 57% in seawater and 70% in sediment. Followed by the 250–1000 µm size group, with 26 % in seawater samples and 22% in sediment samples. The 1–50 µm size was only found in 12% of all sea- water samples and 6% of all sediment samples. Microplastics with sizes 1–10 mm were rarely found, only 6% of the total seawater MP and 6% of the total sediment MP. Figure 4 is a bar graph displaying the color and size distribution at each station in Pekalongan waters.
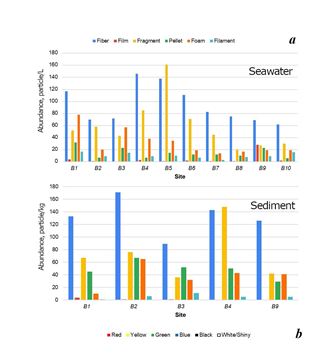
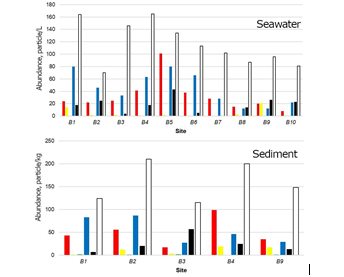
F ig . 4. Distribution chart of microplastics by types (a), colors (b), and size (c) in each site
Р ис . 4 . Распределение микропластика по типу (а), цвету (b) и размеру (с) на каждой станции
Соntinued Fig. 4 / Продолжение Рис. 4
Discussion
The presence of MPs in the water and sediments in Fig. 2 related to the texture of the sediment which affects their ability to capture microplastics. The softer the sediment texture, the better its ability to capture microplastics [23]. Based on the research conducted by Yuanita et al. in 2022 [24], the type of sediment in coastal Pekalongan is non-cohesive sediment dominated by sand. This may affect the num- ber of microplastic particles in Pekalongan sediments. In addition to certain accu- mulation zones in the high seas, marine debris is often more prevalent in shallow coastal areas [25]. This theory is consistent with the present study, where areas close to anthropogenic activities such as rivers, estuaries and coasts had higher abundance compared to central and deep-water areas. Coastal areas sampled both offshore and nearshore by Montoto et al. in 2020 [26] also showed this difference.
The MPs fibers shown in Fig. 3, a, are usually ascribed to terrestrial sources, such as river flow and urban runoff [27]. These fiber microplastics are most likely detached from clothing and fabrics through washing or from fishing lines and ropes used in nearby shipping and fishing operations [28]. While the fragment type pre- sent in Fig. 3, a were mainly generated by fragmentation of plastic products con- taining hard plastic polymers, such as packaging (beverage bottles and plastic con- tainer) [29]. Microplastics in the form of foam are widely used as packaging mate- rials (food containers) and transportation packaging [30]. In addition, the pellet form had less quantity compared to other groups of microplastic forms. Typically, pellets come from the direct discharge of primary microplastics from manufactured plastic waste and residential waste products used for personal care [31].
The results of ATR-FTIR analysis for Pekalongan waters were similar to the research results by Ismanto et al. (2023) [32] that found polystyrene, polyester, and polyamide in the stream area up to the estuary of the Loji River in Pekalongan. In the present study, the same polymers, polystyrene (PS), polyethlene (PE), poly- amide (PA), and polyester (PES) were found. Polyester is the dominant polymer, which is commonly used in textile and product packaging industries [33]. Indica- tions of waste from anthropogenic activities are supported by the dominance of fibers and fragments (secondary microplastics) compared to pellets (primary microplastics) [34]. Density also influences the abundance of MPs as it determines how widely they are distributed throughout the water column [35]. The density of polystyrene foam (PS) 0.01–0.05 g/cm3 was used as a reference. This polymer is expected to float on the surface of water because its density is lower than that of seawater (1.0267 g/cm3). However, being denser than water, some polymers, such as solid PS (1.04–1.50 g/cm3), tend to sink slower in the water column [36].
Previous research on microplastics in marine waters and estuaries in Indonesia is shown in Table 2. The abundance of MPs particles in seawaters and sediments in each region varies significantly. The abundance of microplastics in Pekalongan is higher than in several cases, such as Tambak Lorok, Semarang, Indonesia [37], Jakarta Bay, Indonesia [38], and Trengganu Estuary, Malaysia [39]. Several factors cause the large abundance of microplastics in Pekalongan, namely the anthropo- genic waste, small scale industries, and textile industries. Cases with high amounts of microplastics use a mobile water pump with an additional mesh net filter [39]. This method produces an abundance of microplastics comparatively higher than the manual sampling method using a net [34, 40, 41]. Variations in microplastic abundance are greatly affected by the level of pollution, sampling location, and water hydrodynamics in each study area.
Tab l e 2 . Previous microplastics research used for comparison
Т а б л ица 2 . Предыдущие исследования микропластика для сравнения
|
Location / Место- положение |
Sample / Проба |
Methods / Метод |
Identification tool / Инструмент |
Abundance / Концентрация |
Ref. / Ист. |
|
Banten Bay, Indonesia / Залив Бантам, Индонезия |
Sediment / Донные отложения |
Smith- McIntyre grabs / Дночерпа- тель Смита – МакИнтура |
Nikon Eclipse E600 stereo microscope / Стереомикро- скоп Nikon Eclipse E600 |
267 ± 98 particles/kg / 267 ± 98 част/кг |
[42] |
|
Tambak Lorok, Semarang, Indonesia / Тамбак Лорок, Семаранг, Индонезия |
Water and sediment / Вода и донные отложения |
Gravity corer / Гравита- ционный пробо- отборник |
Microscope Olympus MD 50 / Микроскоп Olympus MD 50 |
7–111 particles/10 mL seawater and 8–49 particles/g sediment / 7–111 част/10 мл морской воды и 8–49 част/г донных отложений |
[37] |
Соntinued Table 2 / Продолжение Таблицы 2
|
Location / Место- положение |
Sample / Проба |
Methods / Метод |
Identification tool / Инструмент |
Abundance / Концентрация |
Ref. / Ист. |
|
Bintan Water, Indonesia / Бинтан, Индонезия |
Water / Вода |
Neuston net / Нейстонная сеть |
Hirox Digital Microscope KH-8700 / Цифровой микроскоп Hirox KH-8700 |
0.45 pieces per m3 / 0.45 шт./м3 |
[40] |
|
Jakarta Bay, Indonesia / Залив Джакарта, Индонезия |
Surface Water / Вода из поверх- ностного слоя |
Round net / Круглая сеть |
Nikon SMZ 745T stereo microscope / Стереомикро скоп Nikon SMZ 745T |
9.729 to 89.164 nm–3, with an average of 48.179 ± 21.960 nm–3 / 9.729–89.164 нм–3, среднее 48.179 ± 21.960 нм–3 |
[38] |
|
Lampung and Sumbawa, Indonesia / Лампунг и Сумбава, Индонезия |
Sediment and sandfish / Донные отложения и Holothuria scabra |
Van Veen grab & local fishers / Пробо- отборник Ван Вина и местные рыбаки |
Nikon Eclipse Ni–U microscope / Микроскоп Nikon Eclipse Ni–U |
72.64 ± 25.28 particles/kg (sediments) 2.01 ± 1.59 particles /individual (fish) / 72.64 ± 25.28 част/кг (донные отложения) 2.01 ± 1.59 част/экз. (рыбы) |
[43] |
|
Brantas Water, Indonesia / Вода из р. Бран- тас, Индонезия |
Gambusia affinis |
Random sampling / Случайный отбор |
Olympus CX-23 Lighting System / Микроскоп Olympus CX-23 |
Downstream (209.18 ± 48.85 particles/g) upstream (24.44 ± 0.14 particles/g) / В нижнем течении (209.18 ± 48.85 част/г), в верхнем течении (24.44 ± 0.14 част/г) |
[44] |
|
Ciliwung Estuary, Indonesia / Устье р. Чиливунг, Индонезия |
River flow (9.37 ± 1.37 particles/m3), Manta trawl coastal waters (8.48 ± 9.43 particles/m3), Water and net & Nikon DF-12 and in 75% samples of Aplocheilus randomly stereo Aplocheilus sp. sp. / collected / microscope / (1.97 particles/individual) [41] Вода и Сеть Стерео- / В речных водах Aplocheilus «Манта» и микроскоп (9.37 ± 1.37 част/м3), sp. случайный Nikon DF-12 прибрежных водах отбор (8.48 ± 9.43 част/м3) и в 75 % проб Aplocheilus sp. (1.97 част/экз.) |
||||
End of Table 2 / Окончание Таблицы 2
|
Location / Место- положение |
Sample / Проба |
Methods / Метод |
Identification tool / Инструмент |
Abundance / Концентрация |
Ref. / Ист. |
|
Benoa Bay, Bali, Indonesia / Залив Беноа, Бали, Индонезия |
Surface water / Вода из поверх- ностного слоя |
Mini manta trawl net equipped with flow- meter / Мини-сеть «Манта» с измерите- лем скорости течения |
Stereo microscope Nikon Eclipse Ni-U / Стереомикро- скоп Nikon Eclipse Ni-U |
1.41–1.88 particles/m3 / 1.41–1.88 част/м3 [34] |
|
|
Trengganu Estuary, Malaysia / Устье р. Тренг- гану, Малайзия |
Seawater & zoo- plankton / Морская вода и зоопланк- тон |
Mobile water pump & 2000 μm mesh net filter / Мобильный насос и сетчатый фильтр с ячеей диаметром 2000 мкм |
Olympus SZX7, Olympus CX21 |
545.8 particles/m3 / 545.8 част/м3 [39] |
|
|
Yellow Sea, China / Желтое море, Китай |
Surface water / Вода из поверх- ностного слоя |
Manta trawl net / Сеть «Манта» |
Stereo microscope M205FA / Стерео- микроскоп M205FA |
0.63 ± 0.57 particles/m3 / 0.63 ± 0.57 част/м3 [45] |
|
|
Northern Indian Ocean / Северная часть Индийского океана |
Surface water / Вода из поверх- ностного слоя |
Manta net / Сеть «Манта» |
Nikon SMA800N |
Pre-monsoon 15,200 ± 7999 no./km2, monsoon 18,223 ± 14,725 no./km2 and post monsoon 72,381 ± 77,692 no./km2 / [46] До муссона 15,200 ± 7999 шт./км2, муссон 18,223 ± 14,725 шт./км2 и после муссона 72,381 ± 77,692 шт./км2 |
|
Conclusion
The assessment and characterization of microplastics in the waters around Pekalongan showed that both seawater and sediment samples were polluted with microplastics. The average microplastics abundances were 214.4 particles/m³ in seawater and 300.0 particles/kg in suspended sediments. The highest concen- tration of microplastics in the seawater was found in site B5 with a concentration of 360 particles/L, while the highest concentration of microplastics in sediments was found in site B4 (389 particles/kg). Site B5 is located in the located in the mid- water area but still close to the estuary, where the pollution from the surrounding areas flows to the location. Site B4 is in the littoral-intertidal zone where the water is affected by tides and is prime location for sedimentation to occur.
Four main types of microplastics were identified: fibers (44% both in water and sediments), fragments (28% in water and 25% in sediments), foam (15% in water and 13% in sediments), and pellets (7% in water and 16% in sediments). The prevalent fibers are likely to have detached from clothing and fabric or fishing lines and ropes, while the fragments primarily come from the degradation of hard plastic products (bottles, containers).
The dominant color was white, accounting for 54% in water and 53% in sedi- ments. The most widespread size range was 50–250 µm (57 and 70% in water and sediments, respectively).
The detection of various polymers (polystyrene, polyethylene, polyamide and polyester) suggests that the microplastics originate from diverse anthropogenic activities, including urban runoff, fisheries, batik industries.
The existence of widely distributed microplastics in the environment is the reason for the concern about water quality, ecosystems, and human health. Fourteen million tons of microplastics are estimated to be accumulated in the bot- tom of the ocean [47]. Aquatic biotas, ranging from plankton to large marine mammals, are likely to ingest microplastics. Humans are being exposed to micro- plastics through the ingestion of contaminated seafood and other foods and bever- ages, or through the inhalation of airborne microplastics. Along with increasing scientific understanding of the risks caused by plastic pollution and greater policy attention to reduce these risks, multiple governments are now looking at ways to address the emission of microplastics into the environment.
In response to growing concerns over the risks related to plastic pollution, Indonesia has introduced measures to reduce plastic widespread into the environ- ment, mainly through better waste management policies, a ban on single-use plastics that are often discarded carelessly, and restrictions on the manufacture and distribution of personal care products and cosmetics which contain microplas- tics. Indonesia has carried out a priority program to improve waste management in several tourist locations, including marine national parks, to prevent and collect plastic waste in the sea for recycling, as well as address the issue of the impact of plastic waste and microplastics. In 2017, monitoring and surveys of plastic waste in the sea were carried out, using UNEP and NOAA guidelines in 18 coastal areas in 18 cities/districts, from 25 priority cities/districts, and will continue in the fol- lowing years. As with the waste management target following Presidential Regula- tion Number 97 of 2017, namely reducing waste from the source by 30% and waste handling by 70% by 2025, Indonesia is adapting its commitment at the international
level, with a target of reducing marine waste by 70% by 2025 (KLHK (Ministry of Environment and Forestry) press release, 2018). Mitigation efforts from residents can be done through the 6 R movement: Reduce, Reuse, Recycle, Repair, Refuse, Rethink [48], separating the types of waste from the beginning, encouraging the role of government through education and regulation, research and technology support and increase the comfort of the local civilian and visitors so that the func- tion of Pekalongan waters remains sustainable.
1. Plastic waste: challenges and opportunities to mitigate pollution and effective man- agement / M. G. Kibria [et al.] // International Journal of Environmental Research. 2023. Vol. 17. 20. https://doi.org/10.1007/s41742-023-00507-z
2. Degradation Rates of Plastics in the Environment / A. Chamas [et al.] // ACS Sus- tainable Chemistry and Engineering. 2020. Vol. 8, iss. 9. P. 3494–3511. https://doi.org/10.1021/acssuschemeng.9b06635
3. Microplastics: occurrence, effects and sources of releases to the environment in Den- mark / C. Lassen [et al.]. Danish Environmental Protection Agency, 2015. URL: https://backend.orbit.dtu.dk/ws/portalfiles/portal/118180844/Lassen_et_al._2015.pdf (date of access: 28.05.2025).
4. Plastic waste inputs from land into the ocean / J. R. Jambeck [et al.] // Science. 2015. Vol. 347, iss. 6223. P. 768–771. https://doi.org/10.1126/science.1260352
5. Microplastics in marine beach and seabed sediments along the coasts of Dar es Salaam and Zanzibar in Tanzania / A. A. Nchimbi [et al.] // Marine Pollution Bulletin. 2022. Vol. 185. 114305. https://doi.org/10.1016/j.marpolbul.2022.114305
6. Sheavly S., Register K. Marine debris & plastics: environmental concerns, sources, impacts and solutions // Journal of Polymers and the Environment. 2007. Vol. 15. P. 301–305. https://doi.org/10.1007/s10924-007-0074-3
7. Microplastics in Tampa Bay, Florida: abundance and variability in estuarine waters and sediments / K. McEachern [et al.] // Marine Pollution Bulletin. 2019. Vol. 148. P. 97–106. https://doi.org/10.1016/j.marpolbul.2019.07.068
8. Park H., Park B. Review of microplastic distribution, toxicity, analysis methods, and removal technologies // Water. 2021. Vol. 13, iss. 19. 2736. https://doi.org/10.3390/w13192736
9. Microplastics model distribution in Semarang Waters Microplastics model dis- tribution in Semarang Waters / S. Y. Wulandari [et al.] // Research Journal of Chemistry and Environment. 2021. Vol. 25, iss. 1. P. 109–120. URL: https://www.researchgate.net/publication/348379282 (date of access: 28.05.2025).
10. Coyle R., Hardiman G., Driscoll K. O. Microplastics in the marine environment: A review of their sources, distribution processes, uptake and exchange in ecosystems // Case Studies in Chemical and Environmental Engineering. 2020. Vol. 2. 100010. https://doi.org/10.1016/j.cscee.2020.100010
11. Auta H. S., Emenike C. U., Fauziah S. H. Distribution and importance of micro- plastics in the marine environment: a review of the sources, fates, effects and potential solutions // Environment International. 2017. Vol. 102. P. 165–176. https://doi.org/10.1016/j.envint.2017.02.013
12. Plastic pollution in the world’s oceans: more than 5 trillion plastic pieces weighing over 250,000 tons afloat at sea / M. Eriksen [et al.] // PLoS One. 2014. Vol. 9, iss. 12. e111913. https://doi.org/10.1371/journal.pone.0111913
13. Pangestu I. F., Purba N. P., Syamsudin M. L. Microplastic Condition in Indramayu Waters, West Java // Proceedings of the National Seminar on Fisheries and Maritime Af- fairs: Technology, Law and Policy Synergy on Fisheries and Marine Sciences Toward Food Sovereignty in AEC (Bandung, Indonesia) / ed. by E. Afrianto [et al.]. 2016. 382.
14. Duis K., Coors A. Microplastics in the aquatic and terrestrial environment: sources (with a specific focus on personal care products), fate and effects // Environmental Sciences Europe. 2016. Vol. 28. 2. https://doi.org/10.1186/s12302-015-0069-y
15. Chatterjee S., Sharma S. Microplastics in our oceans and marine health // Field Actions Science Reports. 2019. Sp. iss. 19. P. 54–61. URL: https://journals.openedition.org/factsreports/5257 (date of access: 28.05.2025).
16. Wu H., Hou J., Wang X. A review of microplastic pollution in aquaculture: Sources, effects, removal strategies and prospects // Ecotoxicology and Environmental Safety. 2023. Vol. 252. 114567. https://doi.org/10.1016/j.ecoenv.2023.114567
17. Yap H. S., Shukor M. Y., Yasid N. A. The microplastics occurrence and toxic effects in marine environment // Journal of Environmental Microbiology and Toxicology. 2022. Vol. 10, iss. 2. P. 1–6. https://doi.org/10.54987/jemat.v10i2.733
18. Bhuyan M. S. Effects of microplastics on fish and in human health // Frontiers in Envi- ronmental Science. 2022. Vol. 10. P. 1–17. https://doi.org/10.3389/fenvs.2022.827289
19. Distribution, characteristics, and risk assessments analysis of microplastics in shore sediments and surface water of Moheshkhali channel of Bay of Bengal, Bangladesh /S. A. Nahian [et al.] // Science of the Total Environment. 2023. Vol. 855. 158892. https://doi.org/10.1016/j.scitotenv.2022.158892
20. Identification of microplastics in wastewater samples by means of polarized light opti- cal microscopy / I. Sierra [et al.] // Environmental Science and Pollution Research. 2019. Vol. 27. P. 7409–7419. https://doi.org/10.1007/s11356-01907011-y
21. SEM/EDS and optical microscopy analyses of microplastics in ocean trawl and fish guts / Z. M. Wang [et al.] // Science of the Total Environment. 2017. Vol. 603–604. P. 616–626. https://doi.org/10.1016/j.scitotenv.2017.06.047
22. Microscopic techniques as means for the determination of microplastics and nanoplas- tics in the aquatic environment: A concise review / D. Kalaronis [et al.] // Green Ana- lytical Chemistry. 2022. Vol. 3. 100036. https://doi.org/10.1016/j.greeac.2022.100036
23. Assessing Marine Debris in Deep Seafloor Habitats Off California / D. L. Watters [et al.] // Marine Pollution Bulletin. 2010. Vol. 60, iss. 1. P. 131–138. https://doi.org/10.1016/j.marpolbul.2009.08.019
24. Coastal protection system design at the Indonesian Mangrove Center in Pekalongan, Central Java–Indonesia / N. Yuanita [et al.] // IOP Conference Series: Earth and Environ- mental Science. The Fourth International Conference on Sustainable Infrastructure and Built Environment 08/03/2022–09/03/2022 Online. ITB, Bandung, Indonesia. Vol. 1065, iss. 1. 012062. IOP Publishing, 2022. https://doi.org/10.1088/1755-1315/1065/1/012062
25. Katsanevakis S. Marine debris, a growing problem: Sources, distribution, composition, and impacts // Marine Pollution: New Research / Edited by T. N. Hofer. New York : Nova Science Publishers, 2008. P. 53–100.
26. Montoto-Martínez T., Hernández-Brito J. J., Gelado-Caballero M. D. Pump-underway ship intake: An unexploited opportunity for Marine Strategy Framework Directive (MSFD) microplastic monitoring needs on coastal and oceanic waters // PLoS ONE. 2020. Vol. 15, iss. 5. e0232744. https://doi.org/10.1371/journal.pone.0232744
27. Microplastics in seawater, sediment, and organisms from Hangzhou Bay / J. Qu [et al.] // Marine Pollution Bulletin. 2022. Vol. 181. 113940. https://doi.org/10.1016/j.marpolbul.2022.113940
28. Tien C., Wang Z., Chen C. S. Microplastics in water, sediment and fish from the Feng- shan River system: Relationship to aquatic factors and accumulation of polycyclic aromatic hydrocarbons by fish // Environmental Pollution. 2020. Vol. 265, part B. 114962. https://doi.org/10.1016/j.envpol.2020.114962
29. Shim W. J., Hong S. H., Eo S. Chapter 1 – Marine microplastics: abundance, distribu- tion, and composition // Microplastic Contamination in Aquatic Environments / Edited by E. Y. Zeng. Elsevier, 2018. P. 1–26. http://dx.doi.org/10.1016/B978-0-12-813747- 5.00001-1
30. Preliminary study of the source apportionment and diversity of microplastics: taking float- ing microplastics in the South China Sea as an example / T. Wang [et al.] // Environmental Pollution. 2019. Vol. 245. P. 965–974. https://doi.org/10.1016/j.envpol.2018.10.110
31. Di M., Wang J. Microplastics in surface waters and sediments of the Three Gorges Reservoir, China // Science of the Total Environment. 2018. Vol. 616–617. P. 1620–1627. https://doi.org/10.1016/j.scitotenv.2017.10.150
32. A novel report on the occurrence of microplastics in Pekalongan River Estuary, Java Island, Indonesia / A. Ismanto [et al.] // Marine Pollution Bulletin. 2023. Vol. 196. 115563. https://doi.org/10.1016/j.marpolbul.2023.115563
33. Avio C. G., Gorbi S., Regoli F. Plastics and microplastics in the oceans: from emerging pollutants to emerged threat // Marine Environmental Research. 2017. Vol. 128. P. 2–11. https://doi.org/10.1016/j.marenvres.2016.05.012
34. Spatial and temporal distribution of microplastic in surface water of tropical estuary: Case study in Benoa Bay, Bali, Indonesia / Y. Suteja [et al.] // Marine Pollution Bulle- tin. 2021. Vol. 163. 111979. https://doi.org/10.1016/j.marpolbul.2021.111979
35. Flores-Ocampo I. Z., Armstrong-Altahatrin J. S. Abundance and composition of microplas- tics in Tampico beach sediments, Tamaulipas State, southern Gulf of Mexico // Marine Pol- lution Bulletin. 2023. Vol. 191. 114891. https://doi.org/10.1016/j.marpolbul.2023.114891
36. Crawford C. B., Quinn B. Microplastic pollutants. Elsevier Science, 2016. 336 p.
37. Evaluation of polypropylene plastic degradation and microplastic identification in sedi- ments at Tambak Lorok coastal area, Semarang, Indonesia / A. Khoironi [et al.] // Marine Pollution Bulletin. 2020. Vol. 151. 110868. https://doi.org/10.1016/j.marpolbul.2019.110868
38. The deposition of atmospheric microplastics in Jakarta-Indonesia: The coastal urban area / A. I. S. Purwiyanto [et al.] // Marine Pollution Bulletin. 2022. Vol. 174. 113195. https://doi.org/10.1016/j.marpolbul.2021.113195
39. Microplastics in seawater and zooplankton: A case study from Terengganu estuary and offshore waters, Malaysia / Z. D. Taha [et al.] // Science of the Total Environment. 2021. Vol. 786. 147466. https://doi.org/10.1016/j.scitotenv.2021.147466
40. Simultaneous grading of microplastic size sampling in the Small Islands of Bintan water, Indonesia / A. D. Syakti [et al.] // Marine Pollution Bulletin. 2018. Vol. 137. P. 593–600. https://doi.org/10.1016/j.marpolbul.2018.11.005
41. Cordova M. R., Riani E., Shiomoto A. Microplastics ingestion by blue panchax fish (Aplocheilus sp.) from Ciliwung Estuary, Jakarta, Indonesia // Marine Pollution Bulle- tin. 2020. Vol. 161. 111763. https://doi.org/10.1016/j.marpolbul.2020.111763
42. The first occurrence, spatial distribution and characteristics of microplastic particles in sediments from Banten Bay, Indonesia / D. Falahudin [et al.] // Science of the Total En- vironment. 2020. Vol. 705. 135304. https://doi.org/10.1016/j.scitotenv.2019.135304
43. Riani E., Cordova M. R. Microplastic ingestion by the sandfish Holothuria scabra in Lampung and Sumbawa, Indonesia // Marine Pollution Bulletin. 2022. Vol. 175. 113134. https://doi.org/10.1016/j.marpolbul.2021.113134
44. Buwono N. R., Risjani Y., Soegianto A. Distribution of microplastic in relation to water quality parameters in the Brantas River, East Java, Indonesia // Environmental Technolo- gy and Innovation. 2021. Vol. 24. 101915. https://doi.org/10.1016/j.eti.2021.101915
45. Seasonal distribution of microplastics in the surface waters of the Yellow Sea, China / W. Zhang [et al.] // Marine Pollution Bulletin. 2023. Vol. 193. 115051. https://doi.org/10.1016/j.marpolbul.2023.115051
46. Seasonal distribution of microplastics in surface waters of the Northern Indian Ocean / R. Janakiram [et al.] // Marine Pollution Bulletin. 2023. Vol. 190. 114838. https://doi.org/10.1016/j.marpolbul.2023.114838Sdgsdg
47. Microplastic Pollution in Deep-Sea Sediments from the Great Australian Bight /J. Barrett [et al.] // Frontiers in Marine Science. 2020. Vol. 7. 576170. https://doi.org/10.3389/fmars.2020.576170
48. Distribution and mitigation efforts for microplastic pollution in Kendari bay as the main- stay coastal tourism area of Southeast Sulawesi / Muhsin [et al.] // Journal of Physics: Conference Series 2021. Vol. 1899. 012012. https://doi.org/10.1088/1742- 6596/1899/1/012012